
MindFusion.Charting for WebForms
ASP.NET WebForms 응용 프로그램에 차트와 계기(gauges)를 추가합니다.
MindFusion Group사에서 공개
2003년 부터 ComponentSource에서 판매중
더 이상 이 제품을 제공 하지 않습니다.
ASP.NET WebForms 응용 프로그램에 차트와 계기(gauges)를 추가합니다.
MindFusion Group사에서 공개
2003년 부터 ComponentSource에서 판매중

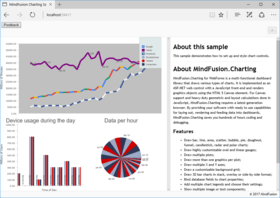
MindFusion.Charting for WebForms is a multi-functional dashboard library that draws various types of charts and gauges. It is implemented as a ASP.NET web control and can easily be integrated with any application targeting the Microsoft ASP.NET platform. By providing your software with ready to use capabilities for laying out, rendering and feeding data into dashboards, MindFusion.Charting for WebForms saves you hundreds of hours coding and debugging.

MindFusion.Charting for WebForms Features
MindFusion Group 사 제품 라이선스 담당자와 라이브 채팅


전화 : 00798 14 800 6332
팩스 : +1 770 250 6199


