


Fornecedor oficial
Como distribuidores oficiais e autorizados, nós fornecemos licenças legítimas diretamente de mais de 200 editores de software.
Ver todas as nossas marcas.

ComponentSource and Nevron have enjoyed a successful 25-year partnership focused on delivering high-quality data visualization solutions to the global developer community. This long-standing cooperation demonstrates a shared commitment to providing developers with tools that simplify and elevate the development process.
Nevron is a leading provider of data visualization tools for Microsoft-centric platforms, specializing in enhancing charting, digital dashboards, and diagrams tailored to meet complex enterprise needs. Its core competencies lie in delivering innovative products that simplify data visualization, streamline analytics, and enhance user experience across enterprise applications. Nevron offers a wide range of customizable tools designed to improve productivity, such as data clarity, workflow efficiency, and overall application performance users. Choosing Nevron products enables businesses to maximize maximize their data insights, streamline development processes, and enhance application functionality for better decision-making.
ComponentSource, a leading distributor of software components and development tools, has played a crucial role in expanding the reach of the Nevrons range. Through this partnership, ComponentSource has helped make Nevron Chart for .NET, Nevron Vision for SharePoint, and other Nevron products accessible to a broader audience of developers.
The enduring collaboration between ComponentSource and Nevron has had a significant, positive impact on the developer community by making powerful data visualization solutions more accessible. As we celebrate a quarter century in partnership, we look forward to strengthening our relationship and continuing to provide developers worldwide with reliable, innovative solutions that enhance their workflows.
Learn more about Nevron.
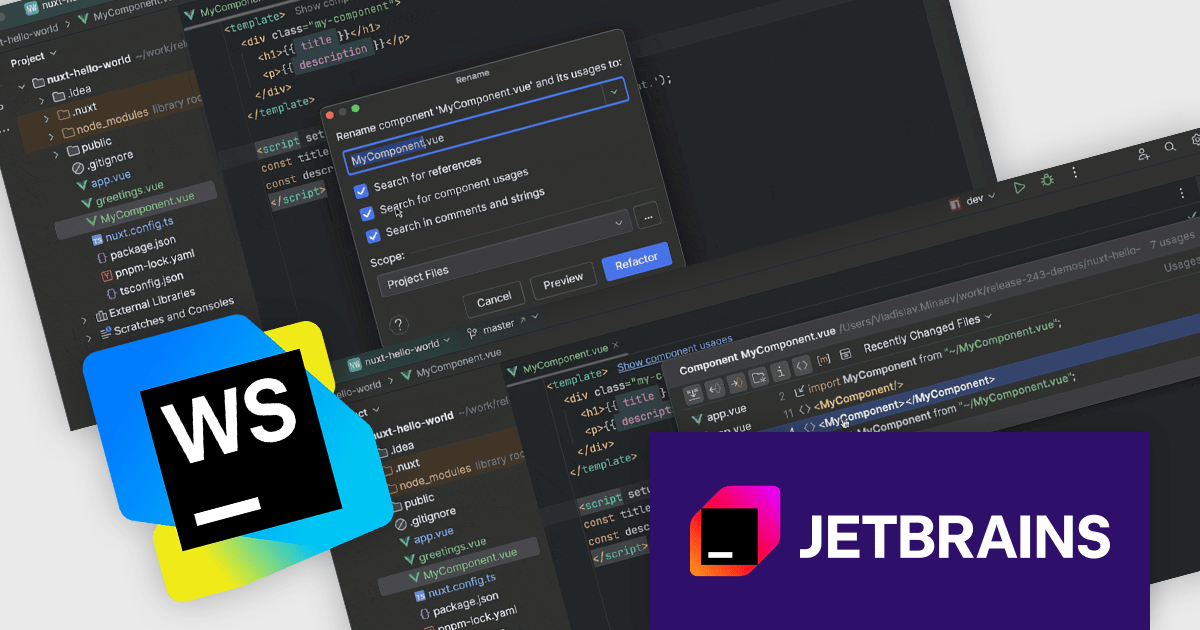
JetBrains WebStorm is a powerful and modern Integrated Development Environment (IDE) specifically designed for web development. It offers a feature-rich environment that supports popular web technologies like JavaScript, HTML, CSS, and Node.js. WebStorm helps you write cleaner, more efficient code with features like syntax highlighting, auto-completion, code refactoring, and built-in testing tools. It integrates seamlessly with various web frameworks and libraries, making it a versatile choice for both front-end and back-end development.
The WebStorm 2024.3 update introduces new in-editor hints for Vue, Svelte, and Astro components that provide immediate insights into component properties, improving workflow efficiency. Enhanced navigation features allow users to locate component usages across imports and templates, while the 'Show Component Usages' filter refines searches for more precise file references. The updated 'Rename' refactoring ensures consistent renaming across projects, making large-scale code adjustments faster and error-free. These improvements are ideal for developers managing complex applications who need accurate, project-wide control over component usage and naming.
To see a full list of what's new in version 2024.3, see our release notes.
WebStorm is licensed per user, and is available as a commercial annual subscription license. We can supply new subscriptions, subscription renewals (including continuity discounts), lapsed renewals, and additional user licenses. See our WebStorm licensing page for full details.
WebStorm is available to buy in the following products:
Text Control is a recognized leader in providing robust and versatile document processing and reporting components for developers building applications on Windows, web, cloud, and mobile platforms. Its solutions empower developers to seamlessly integrate professional-grade document editing, viewing, and generation capabilities into their software, enhancing user experiences and streamlining workflows.
Text Control has updated the following products to support .NET 9, ensuring developers can leverage the latest advancements in the .NET framework to build even more powerful and performant document-centric applications:
TX Text Control .NET for Windows Forms and TX Text Control .NET for WPF are licensed per developer and are available as a Perpetual License with a 12 month support and maintenance subscription. See our TX Text Control .NET for Windows Forms licensing page or TX Text Control .NET for WPF licensing page for full details.
TX Text Control .NET Server for ASP.NET is licensed per developer and is available as a Perpetual License with a 12 month support and maintenance subscription. Run time licenses are required for the deployment to production servers. See our TX Text Control .NET Server for ASP.NET licensing page for full details.
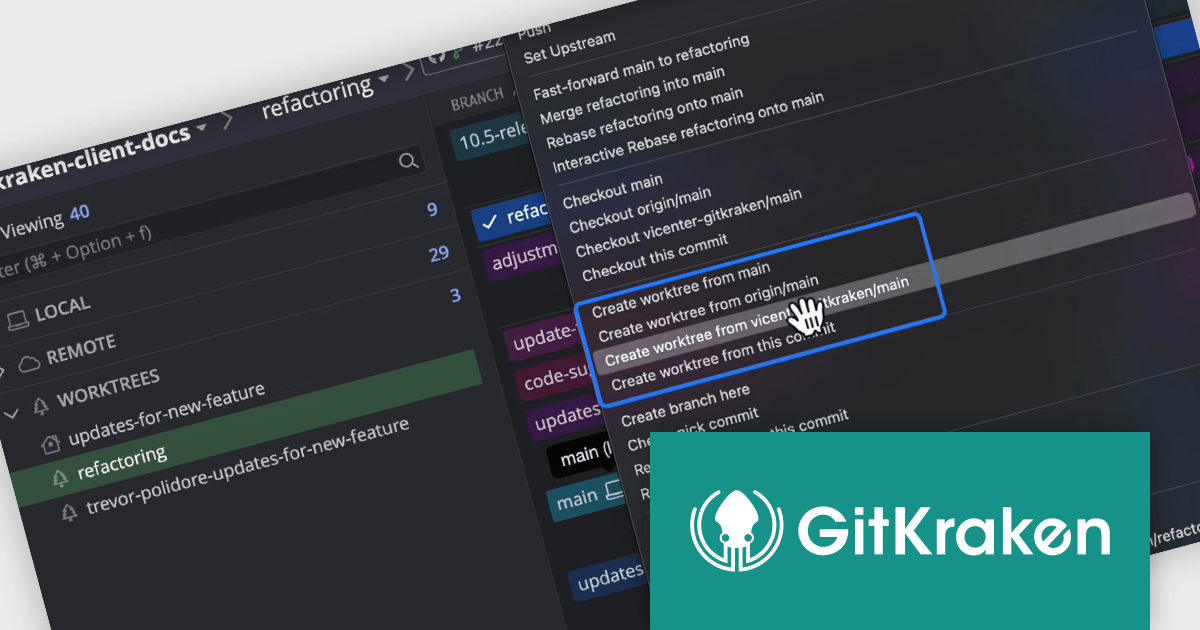
GitKraken is a suite of developer tools built around Git, a popular version control system. It offers a graphical user interface (GUI) that allows developers to interact with Git repositories visually instead of relying on the command line. This simplifies complex Git workflows like resolving merge conflicts and visualizing code history, making Git more accessible and efficient for developers of all experience levels.
The GitKraken Desktop V10.5.0 update introduces a powerful enhancement with its support for Worktrees, a feature that significantly improves branch management and multitasking within repositories. Worktrees allow you to create additional working directories linked to specific branches, enabling you to work on multiple branches simultaneously without altering or risking your main working directory. This capability is especially useful for developers juggling various tasks, such as testing changes, debugging, or developing new features, all within the same repository. By eliminating the need to constantly stash or commit unfinished work just to switch branches, Worktrees streamline workflows, reduce context-switching friction, and provide a safer, more efficient way to manage multiple streams of development.
To see a full list of what's new in V10.5.0, see our release notes.
GitKraken Desktop is licensed per user as an Annual license with free updates and technical support. See our GitKraken licensing page for full details.
Learn more on our GitKraken product page.

Rebex is a trusted provider of high-quality components and libraries designed to streamline the development of secure, efficient, and reliable software applications. Its product line focuses on enabling developers to integrate essential networking, file transfer, and cryptographic functionalities with ease. Key offerings include libraries for secure file transfer protocols like SFTP (SSH File Transfer Protocol) and FTPS (File Transfer Protocol Secure), email handling via SMTP (Simple Mail Transfer Protocol), IMAP (Internet Message Access Protocol), and POP3 (Post Office Protocol), as well as powerful cryptographic tools for securing data. These tools are designed for .NET developers, emphasizing ease of integration, robust security standards, and high performance, making Rebex a valuable resource for building modern software solutions.
The Rebex 7.0.9083 releases introduce a new set of binaries targeting .NET 9 with support for all .NET 9 platforms including Microsoft Windows (x64, x86, ARM64), Linux (x64, ARM32, ARM64), Android (x64, ARM32, ARM64), Apple macOS (ARM64, x64), and Apple iOS/iPadOS/tvOS (ARM64). By adding support for .NET 9, Rebex ensures its products are fully compatible with the latest advancements in Microsoft's flagship development platform, allowing developers to take advantage of enhanced performance, scalability, and new features. Support for .NET 9 is available across the Rebex .NET product range:
Rebex products are licensed per developer. All new licenses include a 1 year support contract which includes priority support and all software updates during the support period. Support contract renewals are also available. See our Rebex licensing page for full details.
Tel: (888) 850 9911
Fax: +1 770 250 6199


