


官方供应商
我们作为官方授权经销商,直接提供超过200家开发厂家所发行超过1000个的产品授权给您。
查看我们的所有品牌。
继续用英语阅读:
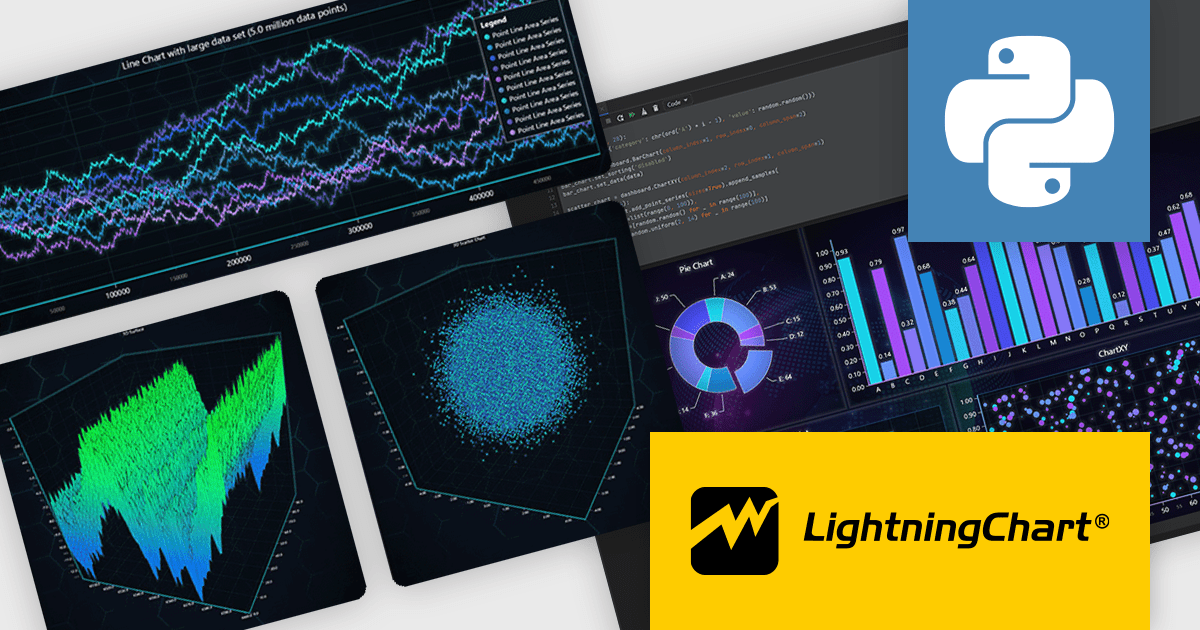
LightningChart Python is a newly released high-performance visualization library designed for real-time analytics and large-scale data rendering. Utilizing GPU acceleration and WebGL, it efficiently processes millions of data points in 2D and 3D with smooth, interactive visuals. It seamlessly integrates with Python’s data ecosystem, including numpy, pandas, and GUI frameworks like PyQt and PySide, making it a powerful tool for interactive dashboards, financial analytics, scientific simulations, and engineering applications.
By offloading rendering to the GPU, LightningChart Python enhances responsiveness, minimizes CPU load, and ensures seamless interaction with complex datasets. Its advanced charting capabilities support real-time monitoring, heatmaps, scatter plots, and dynamic surface charts, delivering the speed, precision, and scalability required for data-intensive applications.
LightningChart Python offers two licensing options: the subscription-based Data Scientist License for internal, non-public facing usage and the perpetual, per-seat Software Developer License for commercial use with professional support and deployment keys. Both licenses allow one active session per user, with developer licenses assigned individually. See our LightningChart Python licensing page for full details.
For more information, see our LightningChart Python product page.
联系电话: (888) 850 9911
传真: +1 770 250 6199


