
LightningChart Python
一个高性能、GPU 加速的 2D 和 3D 数据可视化库,用于数据科学和软件开发 Python 应用程序。
由以下开发商制作:LightningChart
ComponentSource开始代理销售的日期:2021年
一个高性能、GPU 加速的 2D 和 3D 数据可视化库,用于数据科学和软件开发 Python 应用程序。
由以下开发商制作:LightningChart
ComponentSource开始代理销售的日期:2021年

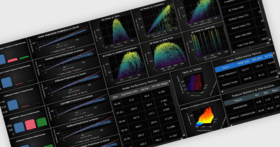
LightningChart Python is a high performing data visualization library for the Python programming language. It allows you to present real-time or static data as fast and interactive 2D or 3D charts. Designed for data scientists and software developers, this GPU-accelerated charting library can handle large static datasets or dynamic real-time streaming data by utilizing graphics processors and WebGL rendering for the smooth visualization of up to millions of data points.


图像1/8
LightningChart Python Features
透过Live Chat与我们的LightningChart 专家联络!


联系电话: (888) 850 9911
传真: +1 770 250 6199


