













官方供应商
我们作为官方授权经销商,直接提供超过200家开发厂家所发行超过1000个的产品授权给您。
查看我们的所有品牌。
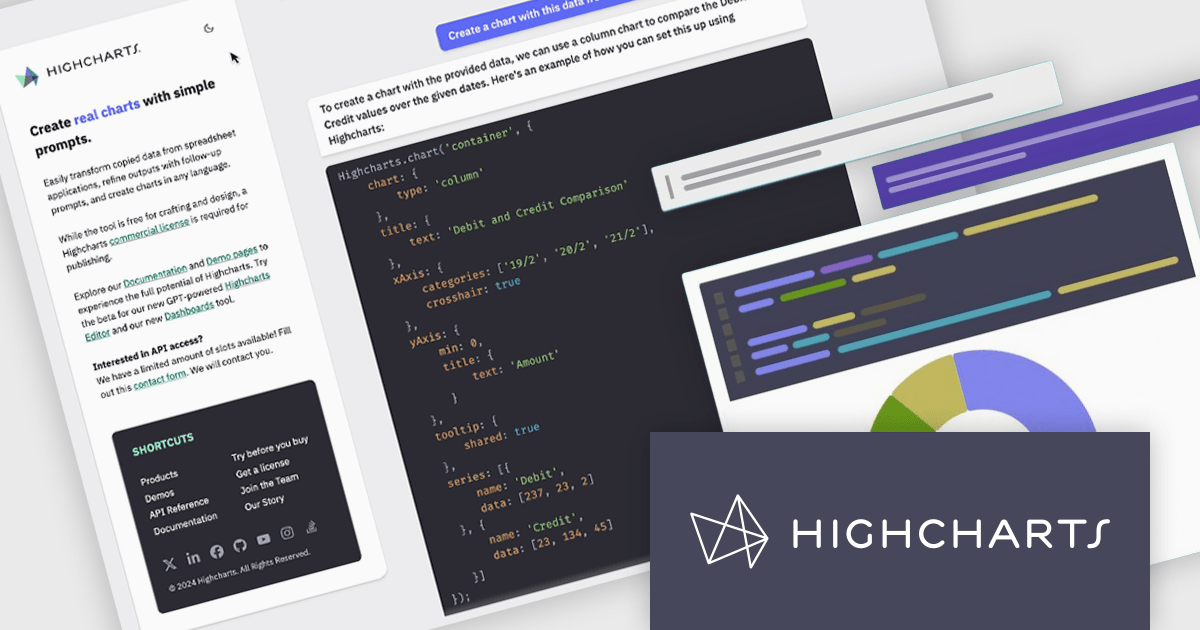
Highcharts is a JavaScript charting framework that allows web developers and data analysts to generate dynamic, visually appealing charts and graphs for websites and web applications. It can display a variety of chart types, including line, spline, area, column, bar, pie, scatter, and many more. Highcharts is well-known for its ease of use, rich documentation, and ability to handle huge datasets efficiently. Features include responsive design, accessibility support, and cross-browser compatibility. Its customization capabilities allow users to create bespoke data visualizations that increase engagement and provide insightful data presentations.
Highcharts GPT has been renamed Highcharts Assist to represent its evolution from an AI assistant associated with a single language model to a universal assistant for the Highcharts platform. Highcharts Assist provides software developers with support across implementation, debugging, licensing, product guidance, and best practices, while its model-agnostic approach allows the underlying AI technology to evolve over time without changing the user experience.
Highcharts Core is licensed on an annual or perpetual basis, OEM licenses, and Advantage Renewals. It is licensed per Developer and has several license options including Internal, SaaS, SaaS+, and Self Hosted. See our Highcharts Core licensing page for full details.
Learn more on our Highcharts Core product page.
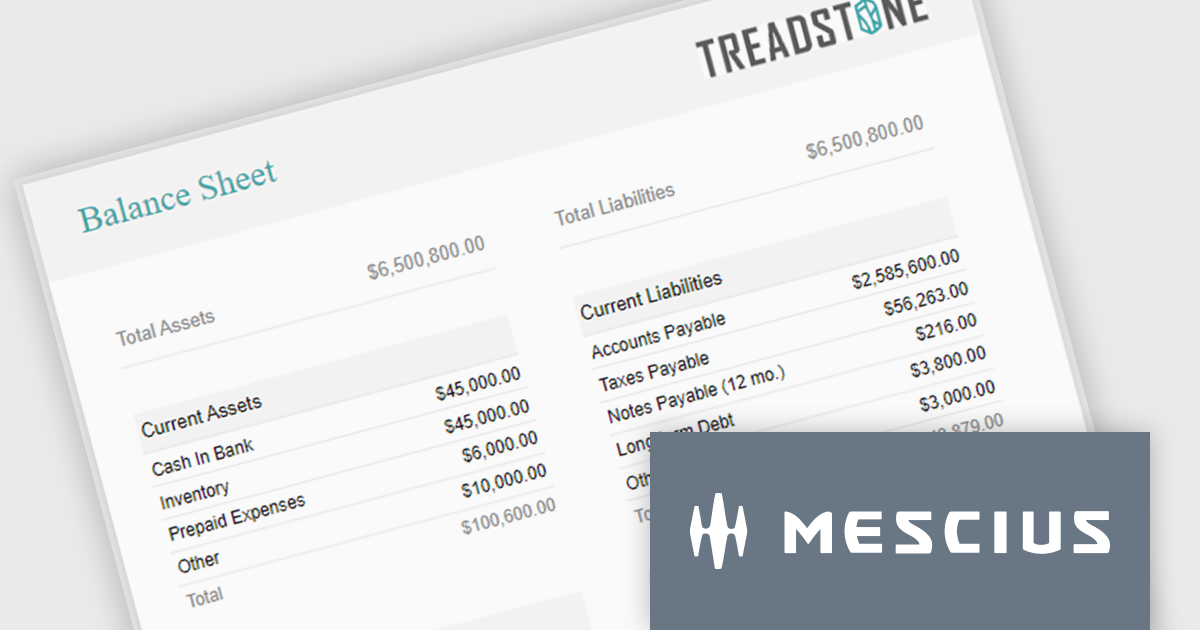
ActiveReportsJS is a powerful, lightweight reporting tool designed to integrate advanced reporting capabilities into any JavaScript application. ActiveReportsJS enables developers to create, view, export, and print richly formatted reports entirely on the client side - with zero server dependencies.
Balance sheets provide a snapshot of an organization's financial position at a specific point in time. By summarizing assets, liabilities, and equity, these reports help creditors, investors, and stakeholders evaluate a company's financial health. In this blog post, MESCIUS Product Manager Joel Parks demonstrates how to use the Angular Report Designer to give users the ability to design, view, and interact with reports directly from within your web application. Steps include:
Read the complete blog to get started creating polished, interactive balance sheets within your web applications.
ActiveReportsJS is licensed on an annual subscription or perpetual basis and is available as a Single Deployment License for non-commercial use, and as a Single Domain License or Unlimited Domain License for commercial and/or SaaS use. See our ActiveReportsJS licensing page for full details.
For more information, visit our ActiveReportsJS product page.
LightningChart JS is a high-performance JavaScript charting library that utilizes WebGL rendering and GPU acceleration to deliver exceptional performance for a wide range of data visualization needs. It is designed to handle large datasets and complex visualizations with ease, enabling developers to create interactive and visually appealing 2D and 3D charts. Ideal for applications demanding smooth real-time data updates, such as financial platforms, engineering tools, scientific research dashboards, and industrial monitoring systems, LightningChart JS provides a comprehensive API for customization and integration into web-based projects.
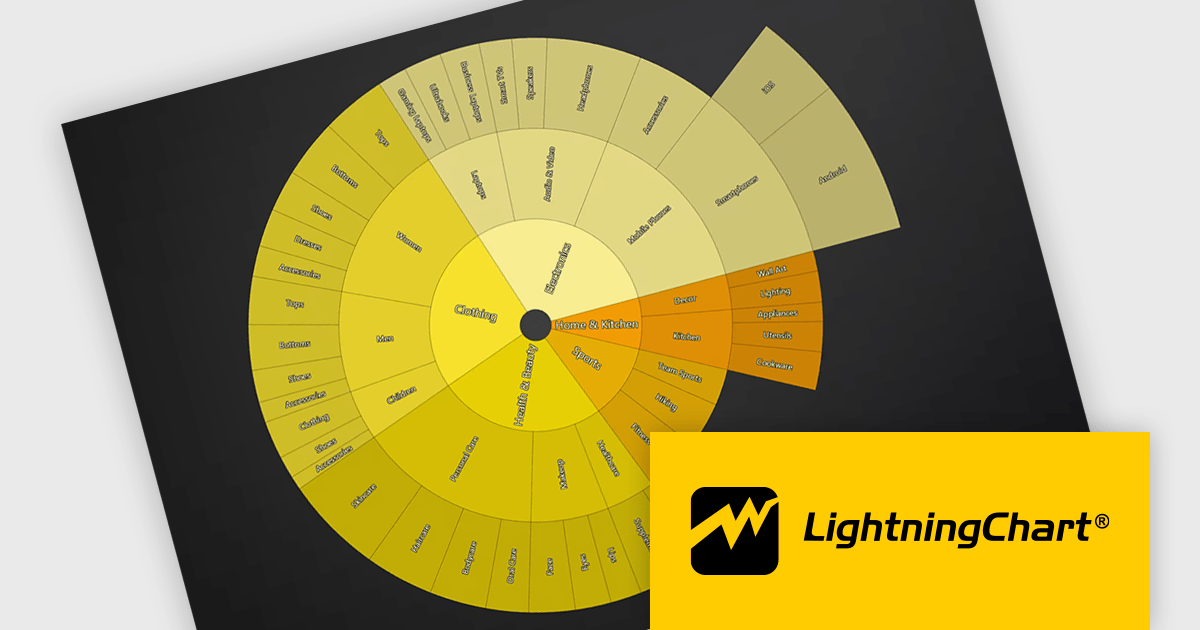
The LightningChart JS v8.3 update introduces Sunburst charts, enabling developers to visualize hierarchical data in a compact and intuitive format that clearly represents part to whole relationships across multiple levels. By displaying nested categories as proportionally sized segments within concentric rings, the chart makes it easier to analyze complex data structures, compare contributions at different hierarchy levels, and identify patterns or dominant categories without requiring multiple visualizations. This helps developers deliver more informative data exploration experiences in applications that rely on organizational, financial, operational, or other structured datasets.
To see a full list of what's new in v8.3, see our release notes.
LightningChart JS is licensed per developer and is available as an annual license with 1 year support. See our LightningChart JS licensing page for full details.
For more information, see our LightningChart JS product page.
Neodynamic offers two JSPrintManager solutions for client-side printing and scanning in web applications. JSPrintManager for Any Web Platform allows you to integrate printing functionality into any website built with technologies like ASP.NET, PHP, or Blazor using pure JavaScript. Neodynamic also offers JSPrintManager for Blazor which enables you to seamlessly add printing capabilities to your Blazor server or WebAssembly projects with C# code. Both solutions empower you to print various data formats directly from the browser without requiring user interaction with print dialogs.
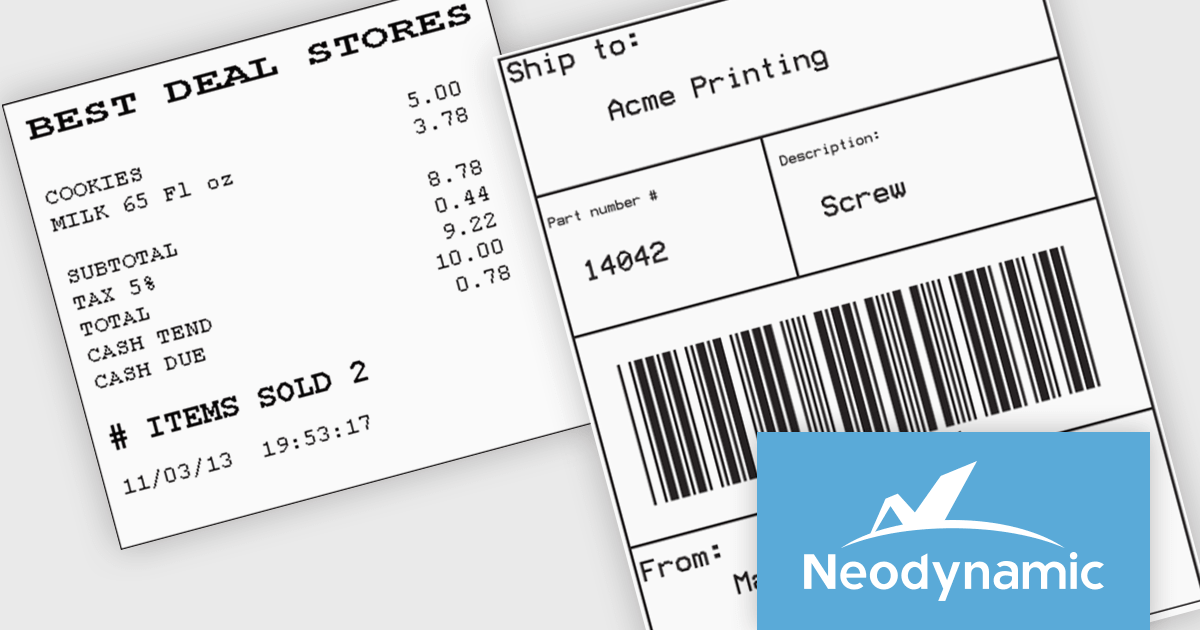
JSPrintManager is well suited to retail and shipping applications where fast, accurate printing is a critical part of daily operations. Developers can print receipts, invoices, packing slips and shipping labels directly to compatible printers using native command languages, helping to ensure consistent output and optimal performance. Support for carrier-generated labels from UPS, FedEx, USPS and DHL makes it easy to integrate fulfillment and logistics workflows, while compatibility with a wide range of receipt and label printers provides the flexibility needed for point-of-sale, warehouse and distribution environments.
Neodynamic JSPrintManager is licensed per Web App and Web server and is available as a Perpetual license which includes 1 year of free updates and priority support. See our Neodynamic JSPrintManager for Any Web Platform and Neodynamic JSPrintManager for Blazor licensing pages for full details.
Learn more on our Neodynamic JSPrintManager for Any Web Platform and Neodynamic JSPrintManager for Blazor product pages.
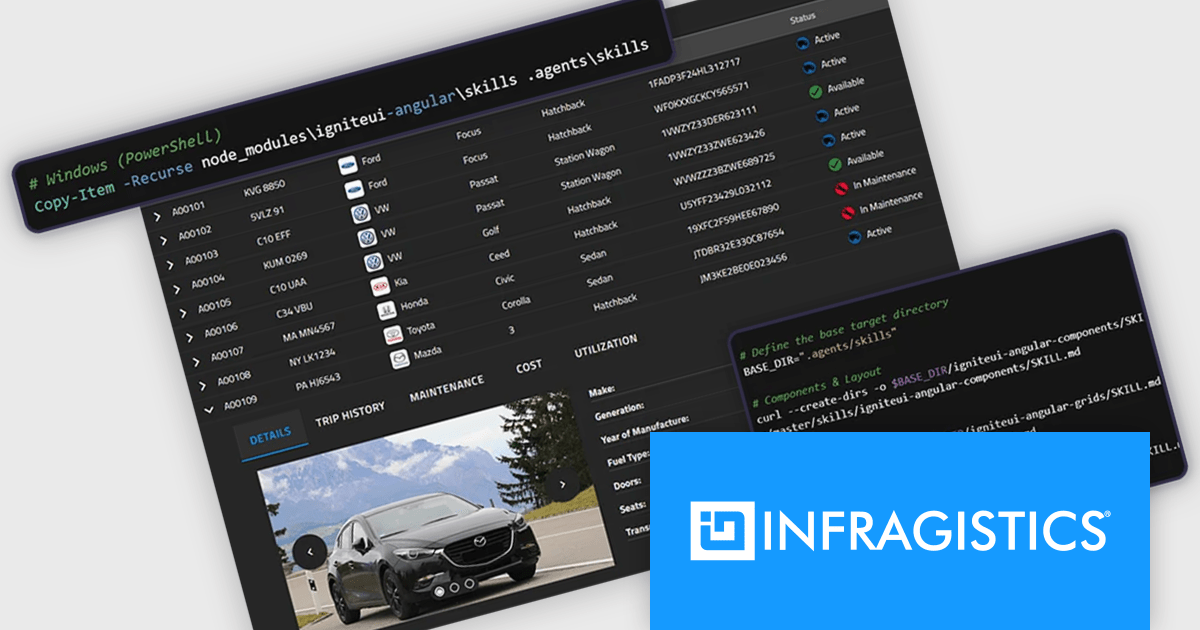
Infragistics Ultimate is a comprehensive development toolkit designed to improve the creation of high-performance, visually rich applications across multiple platforms. It includes a wide range of user interface (UI) components and development tools for web, desktop, and mobile applications, supporting frameworks such as Angular, React, Blazor, .NET, and more.
The Infragistics Ultimate 26.1 release includes an AI-Assisted Development Toolchain which helps ensure AI coding assistants generate applications using the correct Ignite UI components, APIs, import paths, and design tokens, reducing the risk of inaccurate code suggestions. Designed to keep AI-generated development aligned with established design systems and component libraries, the toolchain is available as three independently usable layers. All three layers now support Angular, React, Web Components, and Blazor, giving development teams greater flexibility when incorporating AI-assisted workflows into modern application projects.
To see a full list of what's new in version 26.1, see our release notes.
Infragistics Ultimate is licensed per developer and is available as a Perpetual License with a 1, 2 or 3 year support and maintenance subscription. See our Infragistics Ultimate licensing page for full details.
For more information, visit our Infragistics Ultimate product page.
联系电话: (888) 850 9911
传真: +1 770 250 6199


