


官方供应商
我们作为官方授权经销商,直接提供超过200家开发厂家所发行超过1000个的产品授权给您。
查看我们的所有品牌。
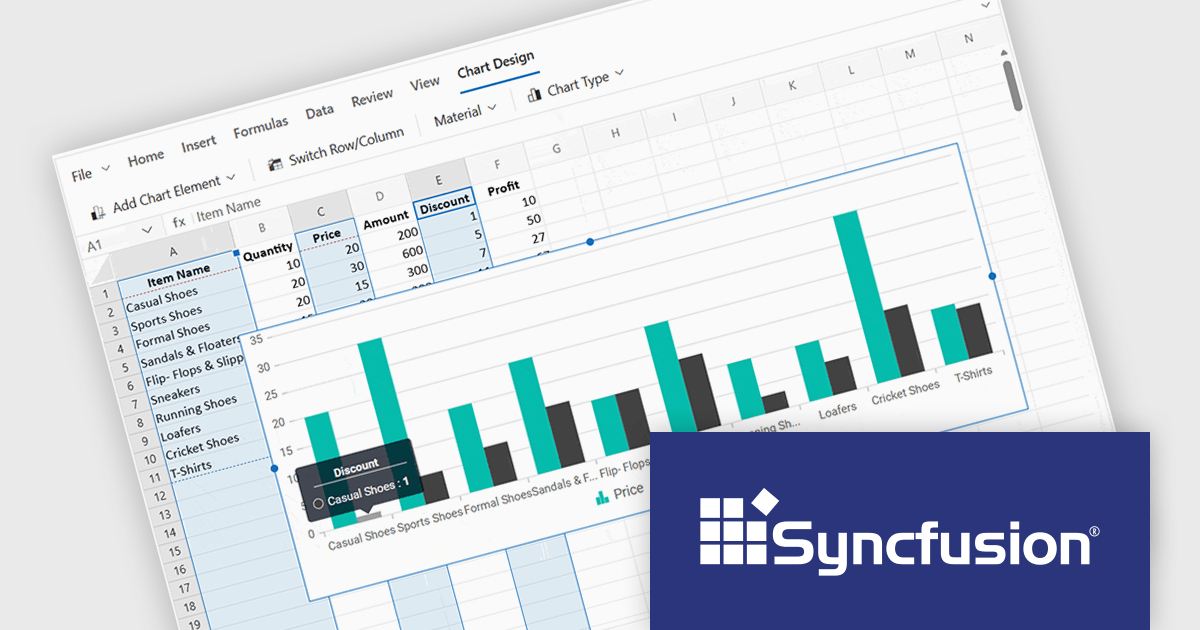
Syncfusion Essential Studio Spreadsheet Editor SDK is a library that lets developers embed spreadsheet functionality into web and desktop applications without requiring Microsoft Excel. It supports editing, formatting, and data analysis features such as cross sheet formula calculation, data binding to local and remote sources including JSON and REST, conditional cell styling, charts, data validation, worksheet protection, and workbook permissions. Available across frameworks including Blazor, React, Angular, Vue, JavaScript, ASP.NET Core and MVC, WPF and WinForms, it helps teams deliver a familiar spreadsheet experience for use cases like reporting, budgeting, and forecasting directly within their applications.
The Syncfusion Essential Studio Spreadsheet Editor SDK 2026 Volume 1 update introduces discontinuous chart range support, enabling developers to create charts from multiple non-adjacent rows, columns, or cell ranges without modifying the original data structure. This capability provides greater flexibility when working with complex, fragmented, or selectively relevant datasets, eliminating the need for manual data consolidation or duplication. It also ensures that charts remain automatically synchronized with updates across all referenced ranges, supporting more accurate, efficient, and maintainable data visualization within modern web and enterprise applications.
To see a full list of what's new in Syncfusion Essential Studio Spreadsheet Editor SDK 2026 Volume 1 (33.1.45), see our release notes.
Syncfusion Essential Studio Spreadsheet Editor SDK is licensed per developer on a one year timed subscription basis, with runtime royalty free redistribution included when the subscription is current, and includes one year of unlimited technical support and updates. See our Syncfusion Essential Studio Spreadsheet Editor SDK licensing page for full details.
Learn more on our Syncfusion Essential Studio Spreadsheet Editor SDK product page.
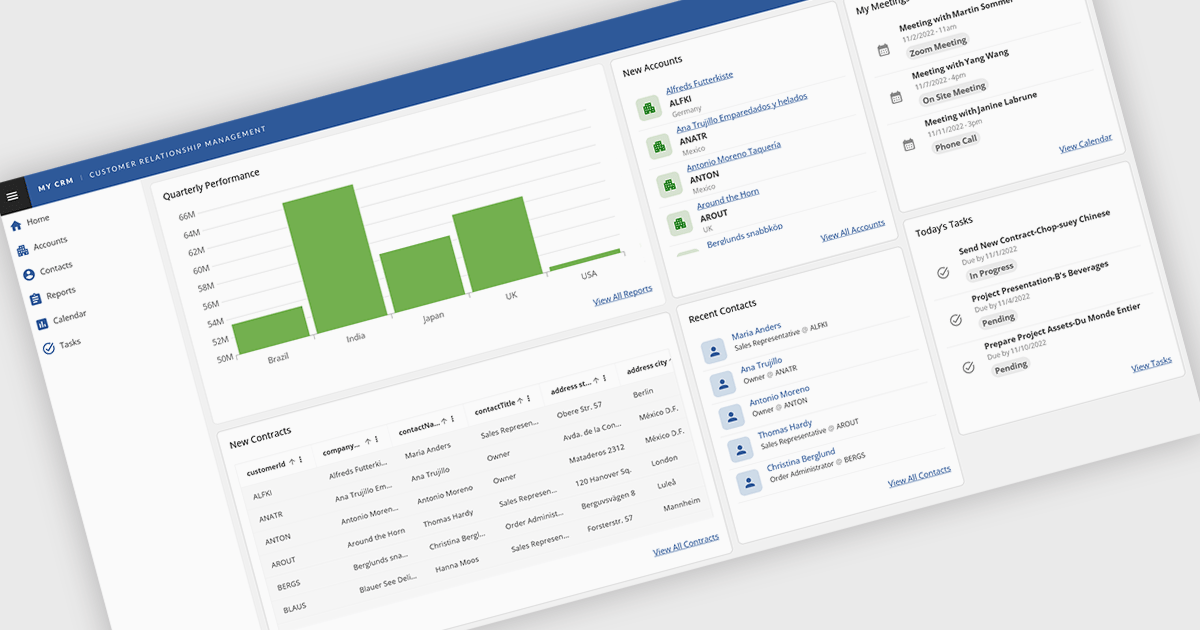
Layout components in UI suites provide structured systems for arranging and aligning interface elements, giving developers a consistent and efficient way to build user interfaces. By simplifying positioning and handling responsive behavior, they reduce development complexity while ensuring a cohesive design across screens and devices. This leads to faster development, improved maintainability, and a better user experience. Common use cases include creating responsive dashboards, organizing forms, structuring navigation, and building applications that need to adapt across multiple devices.
Several Angular UI suites offer layout components including:
For an in-depth analysis of features and price, visit our Angular UI suites comparison.
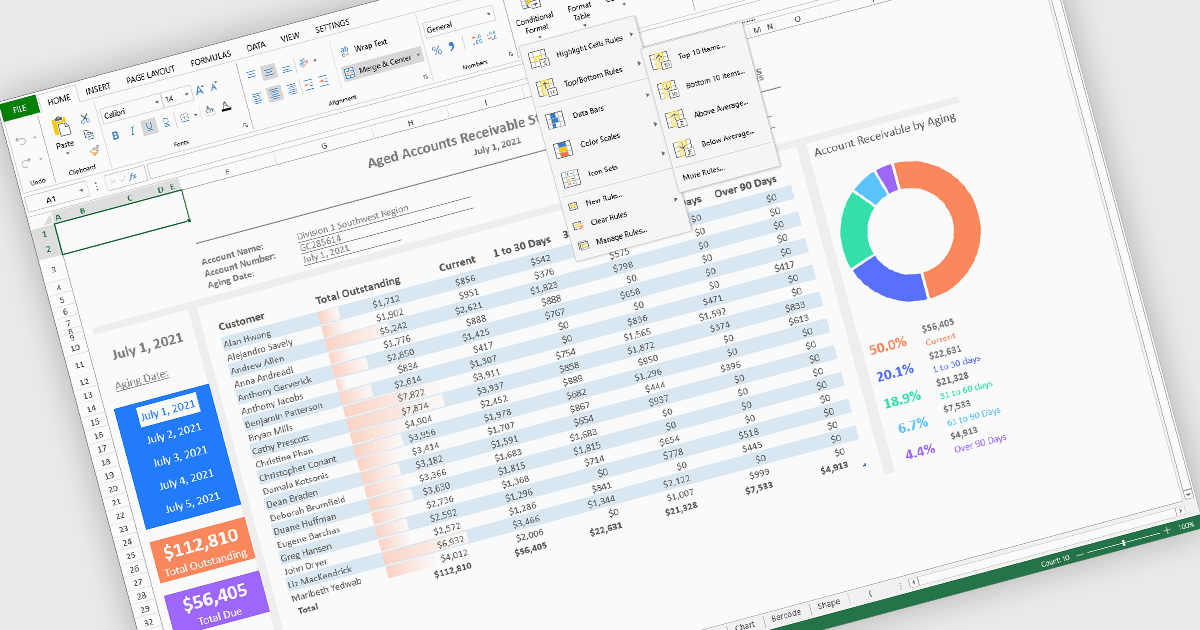
Conditional formatting in spreadsheet components allows developers to dynamically change the appearance of cells based on their values or defined rules. This feature helps highlight important data points, trends, and exceptions without requiring manual updates, making it easier for users to interpret large datasets at a glance. By applying visual cues such as colors, icons, and data bars, conditional formatting enhances readability and supports faster, more informed decision-making within spreadsheet-driven applications.
Several Angular spreadsheet controls offer support for conditional formatting including:
For an in-depth analysis of features and price, visit our Angular spreadsheet controls comparison.
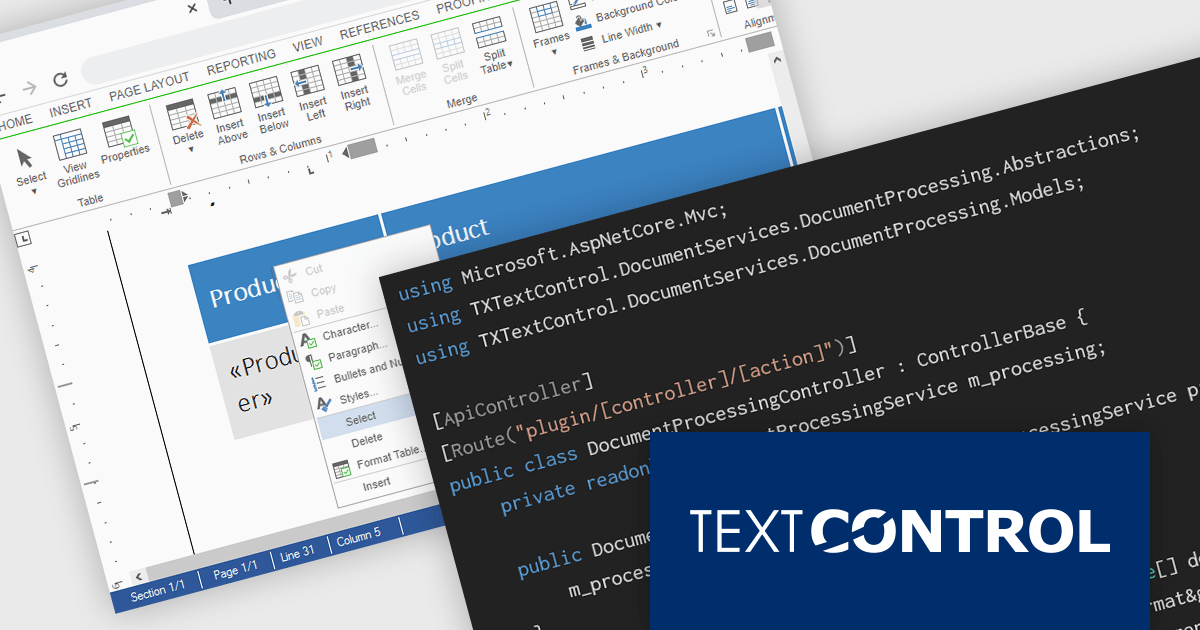
TX Text Control DS Server is a server-side document processing solution designed to integrate document generation, editing, and conversion capabilities into modern applications. Built for web, cloud, and service-based environments, it enables developers to programmatically create and manipulate rich-text documents such as DOCX, PDF, and HTML within their own systems. With APIs designed for integration into .NET applications and other backend services, it supports scenarios such as automated document generation, template-based reporting, and document workflows. By providing high-fidelity rendering and robust document processing on the server, it helps development teams incorporate powerful document functionality into enterprise applications without relying on client-side tools.
The DS Server 5.0 update introduces new Dependency Injection services for plugins, making it easier for developers to extend and integrate DS Server within enterprise applications. Using ASP.NET Core Dependency Injection, plugins can now access internal DS Server functionality through two new services. The IDocumentProcessingService provides programmatic access to document processing capabilities such as document conversion, mail merge processing, document manipulation, PDF form field extraction, and barcode generation. In addition, the IDocumentEditorSessionService enables plugins to interact with active Document Editor sessions, allowing developers to access and modify live documents, work with form fields, adjust formatting, or implement custom logic tied to editor activity. Together, these services provide a flexible way to build powerful extensions and integrate DS Server into complex systems and backend services.
To see a full list of what's new in version 5.0, see our release notes.
Text Control DS Server is licensed per server and is available as an Annual License that includes software updates. See our Text Control DS Server licensing page for full details.
For more information, visit our Text Control DS Server product page.
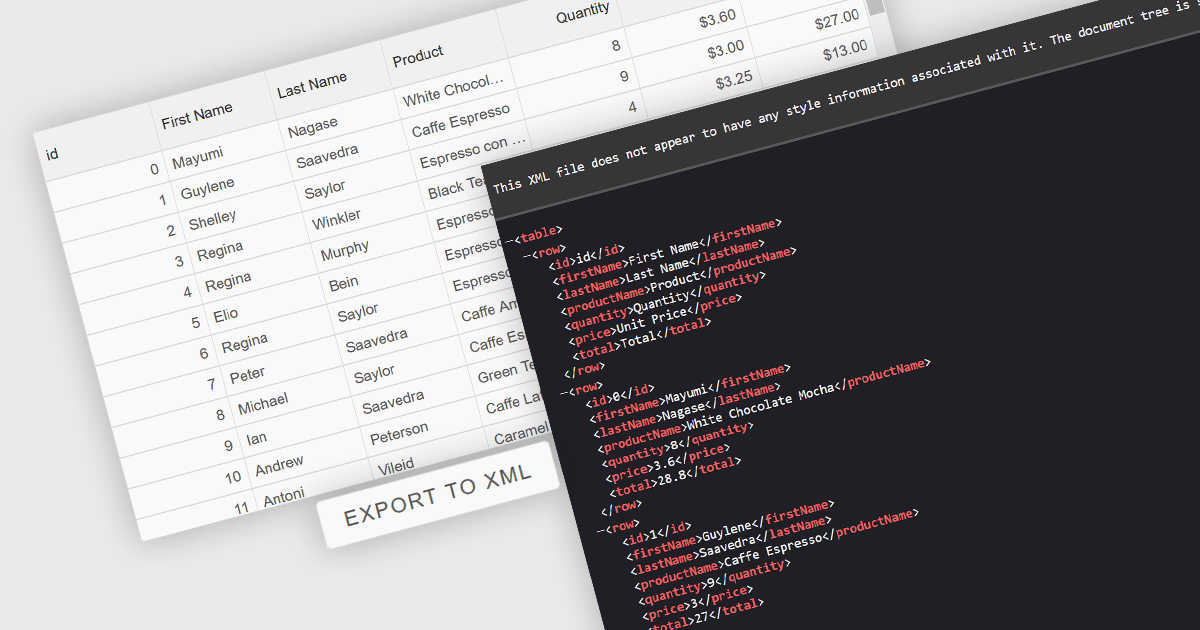
Exporting grid data to XML converts tabular data from a user interface grid into a structured, self-describing format for use beyond the application interface. By organizing data with clearly defined elements, XML ensures consistent interpretation across platforms and systems, regardless of the underlying technology. This enables reliable data exchange, supports interoperability between applications, and makes the data suitable for integration scenarios, long-term storage, and environments that rely on validated, standardized formats for processing and communication.
Several Angular grid components allow you to export to XML, including:
For an in-depth analysis of features and price, visit our comparison of Angular grid components.
联系电话: (888) 850 9911
传真: +1 770 250 6199


