













官方供应商
我们作为官方授权经销商,直接提供超过200家开发厂家所发行超过1000个的产品授权给您。
查看我们的所有品牌。
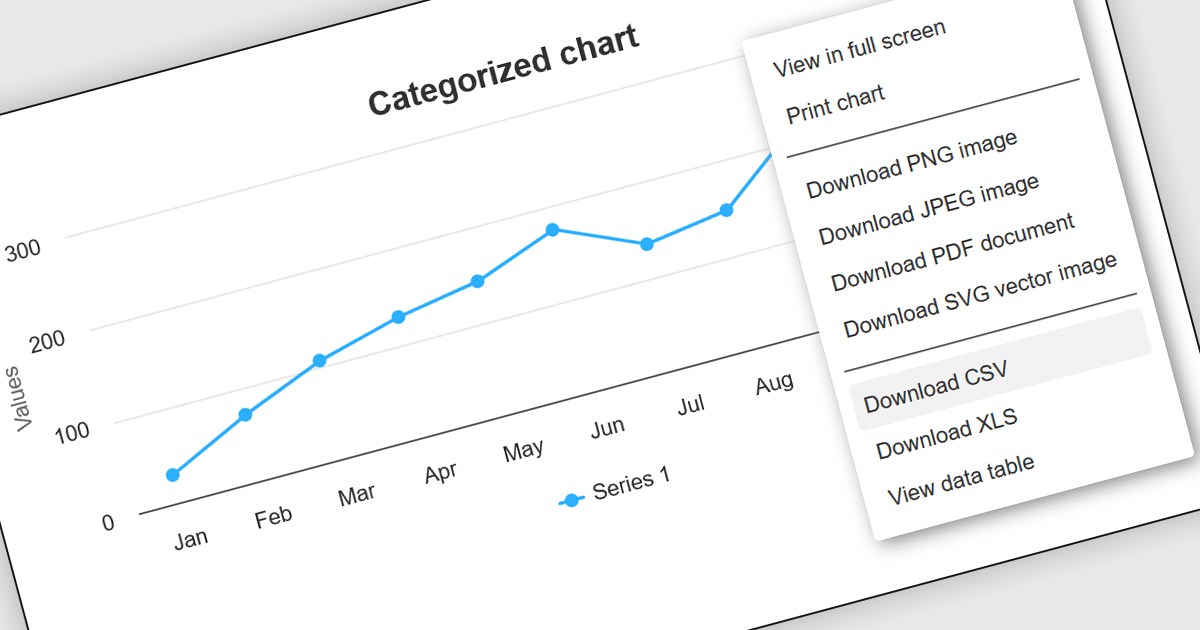
CSV export functionality in Angular chart components enables users to download the data represented in chart form as a CSV (comma-separated values) file directly from Angular-based web applications. This feature is particularly useful for developers who need to provide end-users with the flexibility to manipulate, analyze, or store chart data independently from the web interface. By integrating CSV export, applications can enhance data accessibility and user satisfaction, allowing for data transfer and offline analysis. This functionality also supports better data management practices and can be vital in environments where data needs to be shared across different platforms or systems, thereby increasing the interoperability and practical utility of the application.
Several Angular chart controls offer export to CSV including:
For an in-depth analysis of features and price, visit our comparison of Angular chart controls.
LightningChart JS is a high-performance JavaScript charting library that utilizes WebGL rendering and GPU acceleration to deliver exceptional performance for a wide range of data visualization needs. It is designed to handle large datasets and complex visualizations with ease, enabling developers to create interactive and visually appealing charts for various applications.
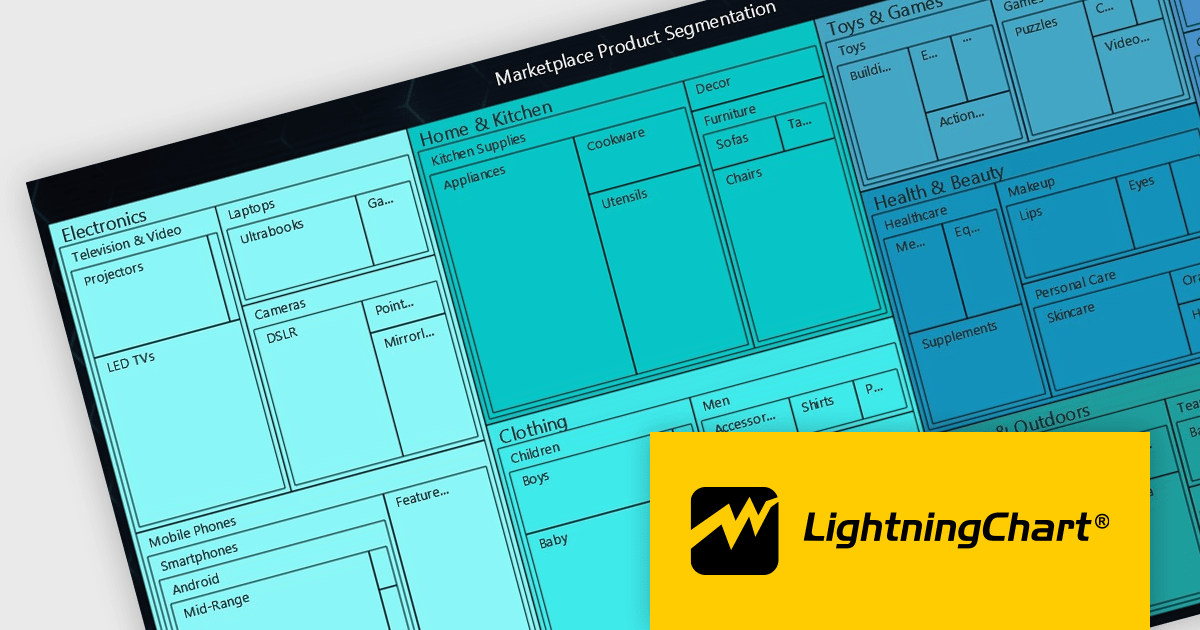
The LightningChart JS v5.2.0 update adds Treemap charts with built-in drill-down functionality, enabling developers to visualize hierarchical data within nested rectangles representing larger or smaller values, depending on their size. This simplifies the complexities involved in understanding large datasets by providing a clear and immediate visual hierarchy of data categories and their relative importance, with the ability to display more depth. This is particularly useful in scenarios such as financial analysis, asset distribution, and organizational structure mapping, where understanding the proportionate distribution of data elements is crucial.
To see a full list of what's new in v5.2.0, see our release notes.
LightningChart JS is licensed based on method of deployment with options including SaaS Developer Licenses, Application Developer Licenses, and Publisher Developer Licenses. Each license is perpetual and includes 1 year subscription for technical support and software updates. See our LightningChart JS licensing page for full details.
Learn more on our LightningChart JS product page.
Smart HTML Elements is an enterprise-grade UI library offering pre-built web components for developers in Angular, React, Vue, Blazor, and JavaScript. It boasts over 60 ready-to-use components like grids, charts, schedulers, and editors, all featuring two-way data binding, responsiveness, accessibility, and theming capabilities. This library helps developers rapidly build dynamic and modern web applications with consistent look-and-feel and rich functionalities, accelerating development time and ensuring professional quality.
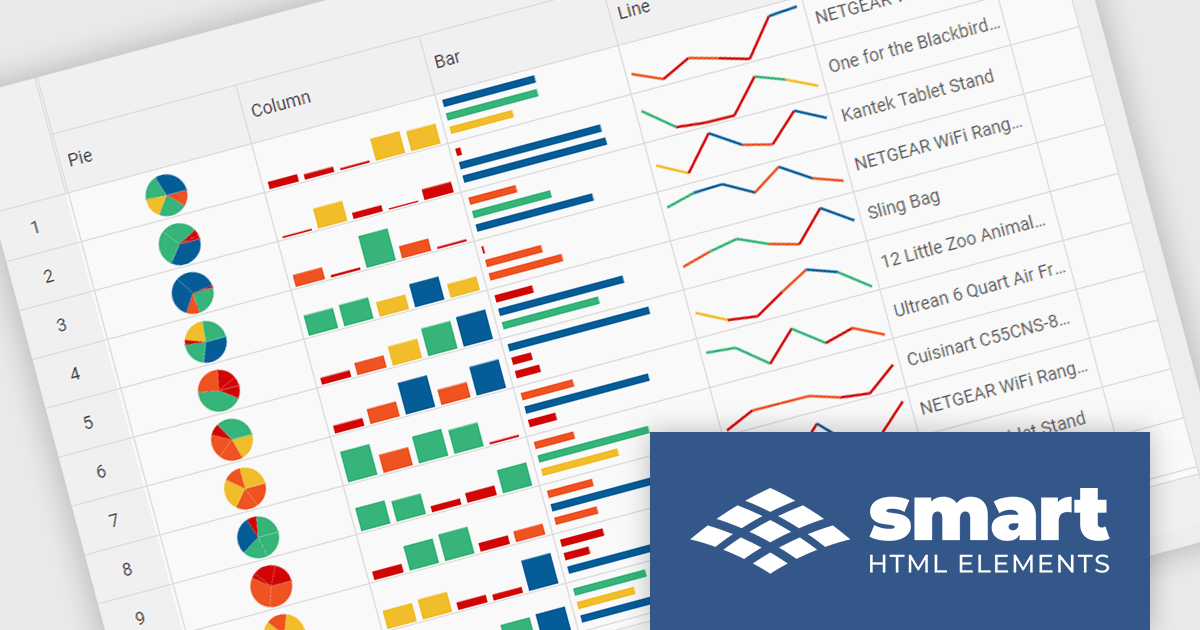
The Smart HTML Elements v19.0.0 release adds support for Grid Sparklines. These are small, data-intense, design simple charts that fit into a single cell of a grid and provide a visual representation of data trends. They are typically used to show trends in a series of values, such as seasonal increases or decreases, economic cycles, or to highlight maximum and minimum values. Grid Sparklines help users to quickly understand patterns and trends in their data without having to create separate charts or graphs.
To see a full list of what's new in v19.0.0, see our release notes.
Smart HTML Elements is licensed per developer and is available as a Perpetual license with 1 year support and maintenance. It includes distribution to Unlimited Web applications, SaaS projects, Intranets and Websites. See our Smart HTML Elements licensing page for full details.
Learn more on our Smart HTML Elements product page.
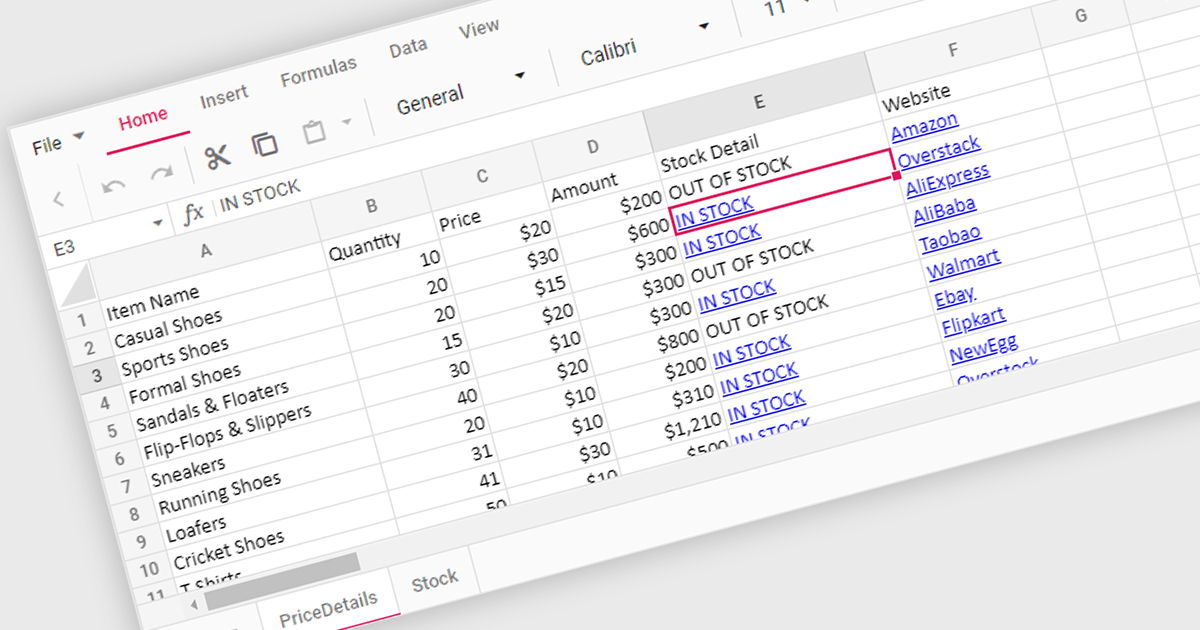
Hyperlink support in a spreadsheet control allows developers to integrate clickable links within cells. This functionality offers several advantages: users can seamlessly navigate to external web pages, reference internal documents within the spreadsheet itself (including across worksheets), and launch email compositions directly from specific cells. Hyperlink support enhances user experience by streamlining information access and promoting efficient data exploration within the spreadsheet.
Several React Spreadsheet controls offer Hyperlink support including:
For an in-depth analysis of features and price, visit our comparison of React Spreadsheet controls.

Aspose.Slides is a software development library that empowers applications to create, edit, and convert presentations without requiring Microsoft PowerPoint. Developers can leverage this API to programmatically manage text, shapes, tables, animations, and more within presentations, while also offering conversion capabilities to various formats like PDF, HTML, and image files.
Aspose.Slides 24.4 adds support for exporting PPTX to XML. XML offers a well-defined, text-based format that can be easily parsed and manipulated by various applications and programming languages. This allows developers to extract specific data or elements from presentations for further processing or integration with other systems.
To see a full list of what's new in Aspose.Slides version 24.4, see our .NET, Android via Java, Java, Node.js via Java, and PHP via Java release notes.
Aspose.Slides is offered as Developer Small Business, Developer OEM, Site Small Business, and Site OEM licenses catering to a range of business needs. Licenses are perpetual, and include 1 year of support and maintenance. Subscription renewals are also available. See our Aspose.Words licensing pages for .NET, Android via Java, Java, Node.js via Java, and PHP via Java for full details.
The ability to export PPTX to XML is available in the following Aspose.Slides platforms:
联系电话: (888) 850 9911
传真: +1 770 250 6199


