













官方供应商
我们作为官方授权经销商,直接提供超过200家开发厂家所发行超过1000个的产品授权给您。
查看我们的所有品牌。
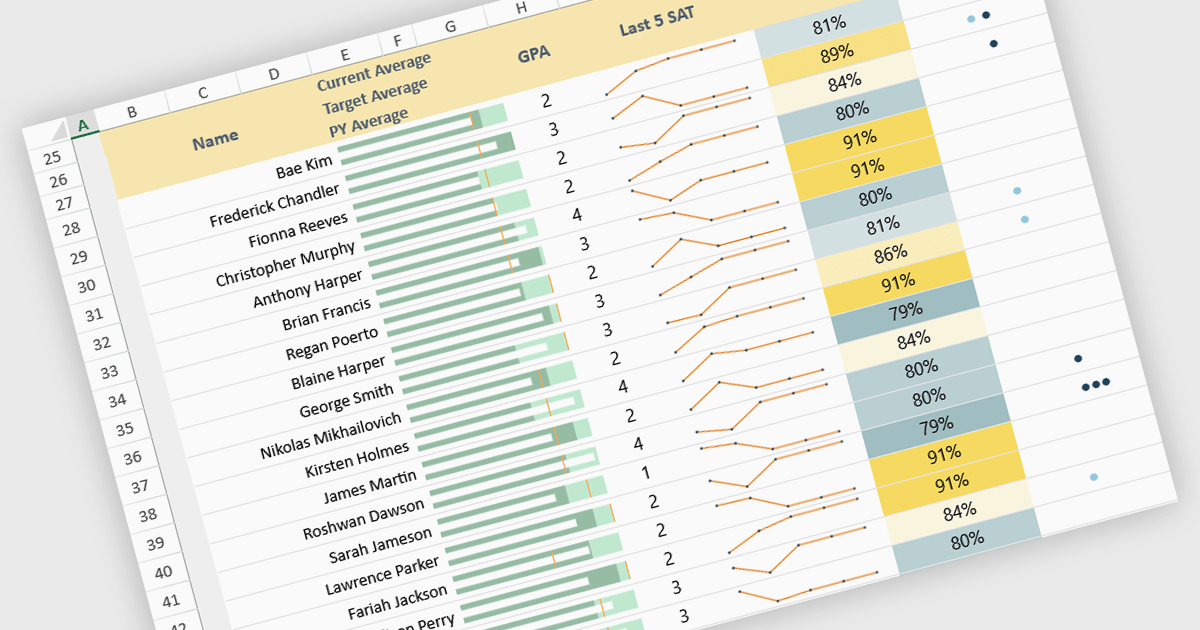
Sparklines in spreadsheets are small, in-cell charts that provide a concise visual summary of data trends without the need for full-sized graphs. They help users quickly identify patterns such as growth, decline, and volatility, making complex information easier to understand at a glance. Because sparklines update automatically with underlying data, they improve real-time analysis and are ideal for dashboards, performance tracking, and financial reporting. Common use cases include monitoring monthly sales performance, comparing product trends side by side, spotting anomalies in operational metrics, and enhancing executive summaries with clear, space-efficient visual context.
Several JavaScript spreadsheet controls offer sparkline functionality:
For an in-depth analysis of features and price, visit our comparison of JavaScript spreadsheet controls.
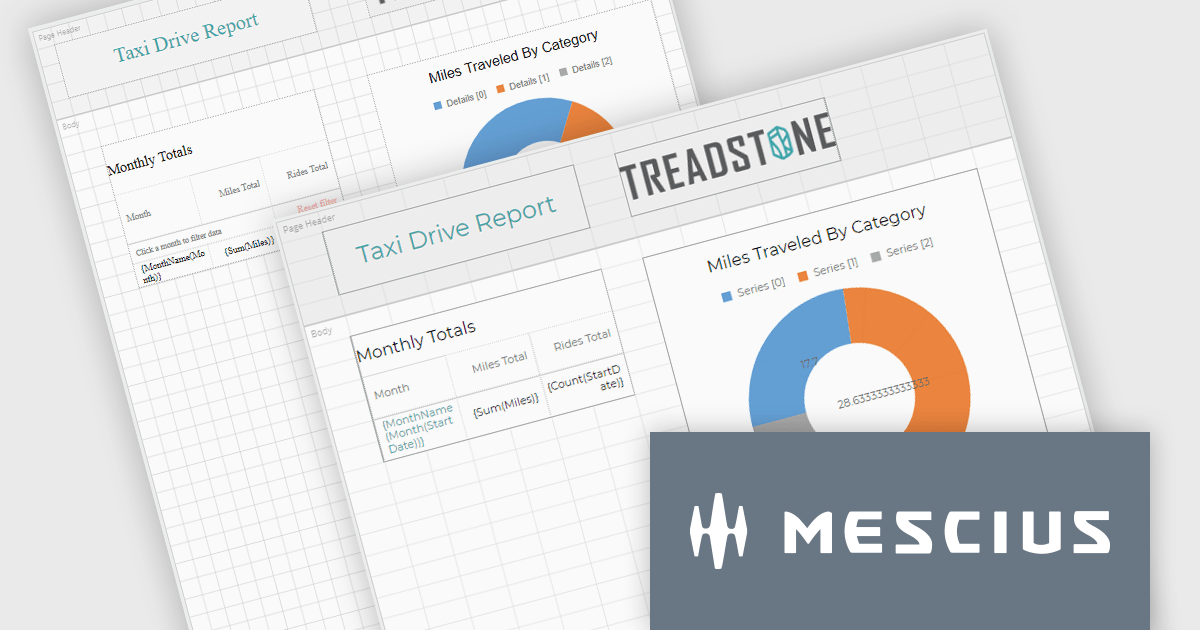
ActiveReportsJS by MESCIUS is a JavaScript reporting toolkit that allows developers to design and embed interactive reports within web applications. It includes a standalone report designer for building reports visually and a JavaScript report viewer component that integrates with web frameworks such as React or vanilla JavaScript. The toolkit supports a range of data visualization options and export formats, helping developers deliver rich, interactive reporting capabilities in the browser.
The ActiveReportsJS v6.0 update introduces a new cell-based layout mode that provides precise control over the alignment and structure of report elements using a grid of cells. This layout mirrors the structure of spreadsheets, making it particularly effective for generating reports intended for export to Microsoft Excel. It helps minimize layout inconsistencies and fragmented cells, ensuring a clean and predictable structure for exported files. Developers benefit from a more consistent and data-oriented layout approach, especially in scenarios where structural accuracy is critical.
To see a full list of what's new in 6.0, see our release notes.
ActiveReportsJS is licensed on an annual subscription or perpetual basis and is available as a Single Deployment License for non-commercial use, and as a Single Domain License or Unlimited Domain License for commercial and/or SaaS use. See our ActiveReportsJS licensing page for full details.
Learn more on our ActiveReportsJS product page.
ONLYOFFICE Docs is a comprehensive online editor, allowing users to create text documents, spreadsheets, presentations, and forms. It enables your users to edit, share, and collaborate on documents online in their preferred browser, within your own application. It is fully compatible with OOXML (Office Open XML) formats and supports popular Microsoft Office and other document formats such as CSV, DOC, DOCX, EPUB, HTML, ODP, ODS, ODT, PDF, PPT, PPTX, RTF, TXT, XLS, and XLSX.
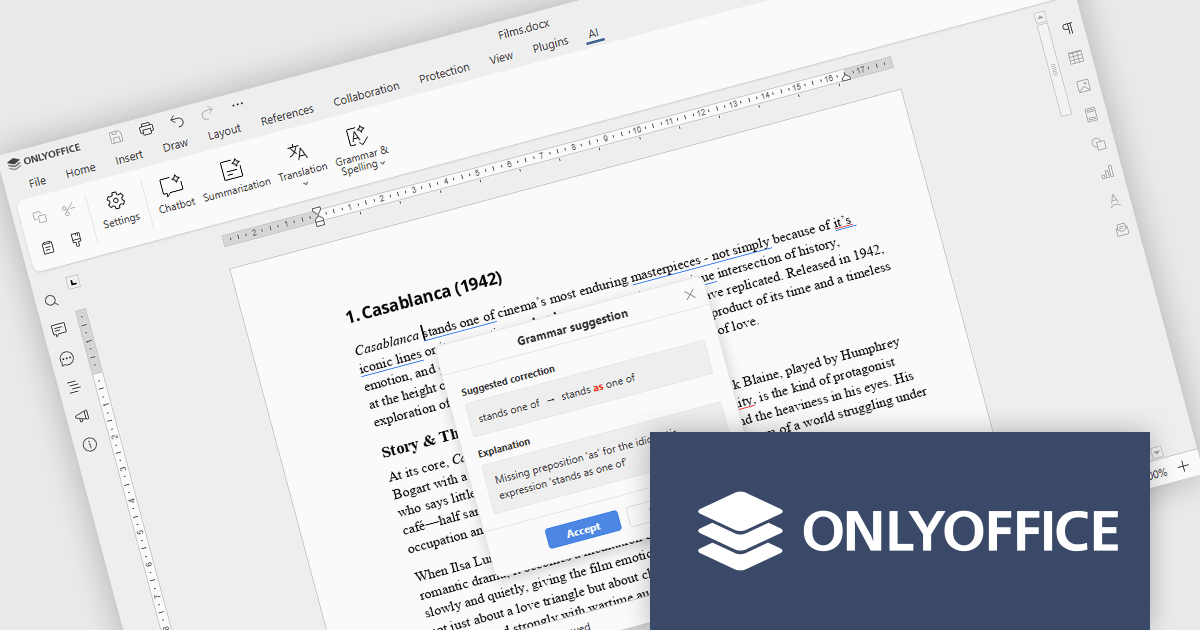
The ONLYOFFICE Docs v9.2 update integrates AI-powered spell and grammar checking, now available directly through the AI plugin, so developers can review and refine documentation without leaving their editing environment. This reduces the time spent on proofreading and eliminates the need to rely on separate tools or browser extensions for basic language quality checks. As a result, development teams can keep their documentation professional and easy to understand while staying focused on implementation, code quality, and delivery timelines.
To see a full list of what's new in v9.2.0, see our release notes.
ONLYOFFICE Docs Developer Edition is licensed by the number of simultaneous document connections and is available as an annual license with 1 year support and upgrades. See our ONLYOFFICE Docs Developer Edition licensing page for full details.
For more information, see our ONLYOFFICE Docs Developer Edition product page.
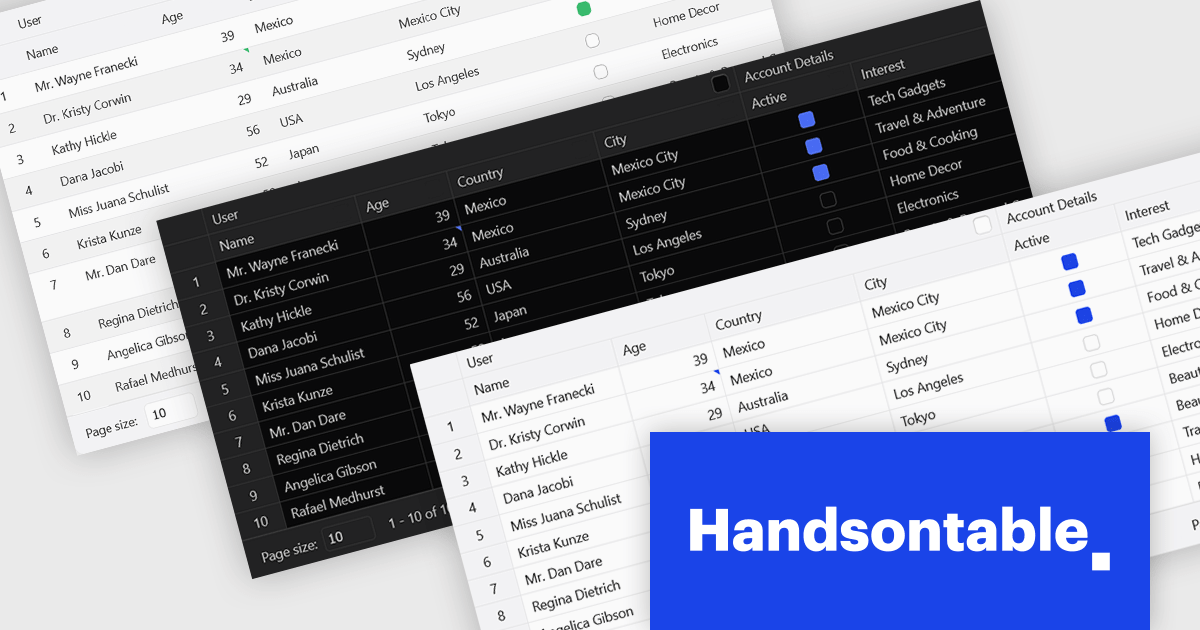
Handsontable is a JavaScript library designed to help developers build interactive data grids into their web applications. Offering a familiar spreadsheet-like interface, it allows users to edit, sort, and filter data with ease. Highly customizable and compatible with popular frameworks like React and Angular, Handsontable empowers developers to build robust data manipulation features into their web applications.
The Handsontable 16.2.0 update introduces a redesigned approach to CSS theming with the addition of an alias-based variable system. This new hierarchy organizes CSS variables into logical layers, separating core values from theme-specific settings. As a result, developers can now apply consistent visual customization across the grid while maintaining clean, manageable stylesheets. This change significantly reduces the guesswork involved in identifying the correct variables and improves maintainability by clearly documenting the relationships between base tokens and theme aliases. It's a notable enhancement for teams looking to build and manage complex, branded UI components with greater efficiency and clarity.
To see a full list of what's new in version 16.2.0, see our release notes.
Handsontable is licensed per developer and is available as an Annual or Perpetual license with 1 year support and maintenance. See our Handsontable licensing page for full details.
For more information, visit our Handsontable product page.
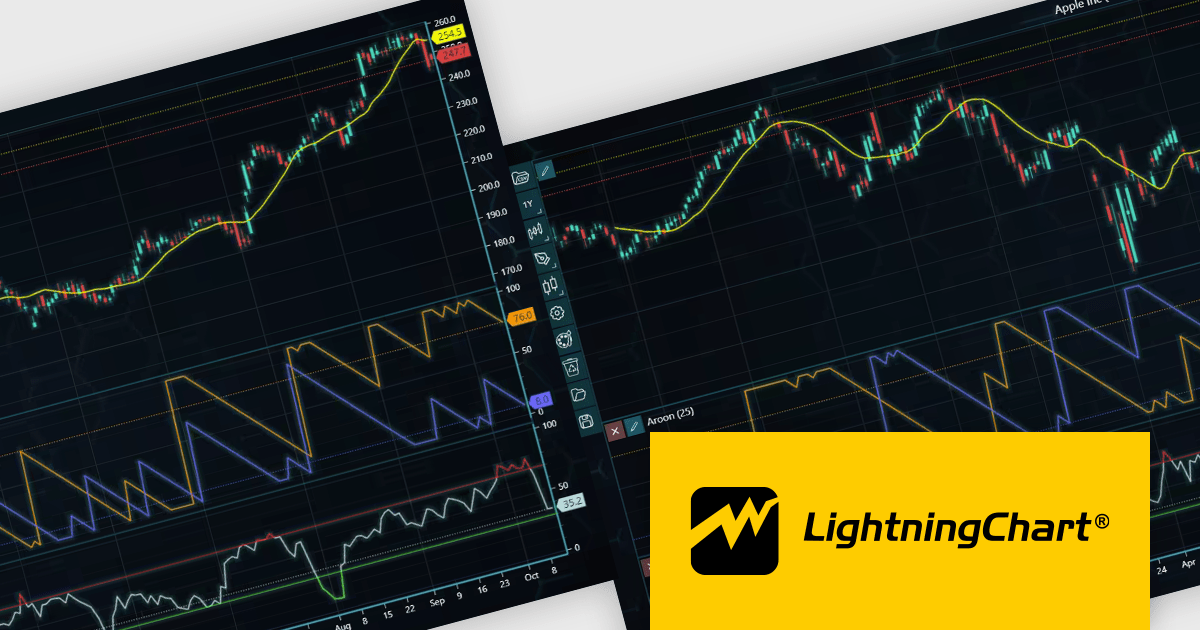
LightningChart JS Trader is a JavaScript/TypeScript library developed by LightningChart that specifically targets the creation of financial and trading applications. It provides high-performance, 2D, 3D, and real-time charting controls and a comprehensive suite of visualizations including candlestick, bar, line, and various technical indicators and drawing tools. This library enables software developers to create interactive technical analysis tools without the need for server-side setup as it runs completely on the client device.
The LightningChart JS Trader v4.0 update introduces a latest price labels feature which automatically displays the most recently received price and indicator values on the Y-axis, giving developers a clear reference point without implementing custom annotations. This built-in functionality reduces development effort by handling label placement and synchronization with incoming data, while configurable options allow teams to show the label, the horizontal line, both, or neither depending on the requirements of their application. As a result, developers can deliver a cleaner, more informative charting experience that makes it easier for end users to quickly interpret current market levels and indicator states.
To see a full list of what's new in v4.0, see our release notes.
LightningChart JS Trader is licensed per developer and is available as an annual license with 1 year support. See our LightningChart JS Trader licensing page for full details.
For more information, see our LightningChart JS Trader product page.
联系电话: (888) 850 9911
传真: +1 770 250 6199


