













官方供应商
我们作为官方授权经销商,直接提供超过200家开发厂家所发行超过1000个的产品授权给您。
查看我们的所有品牌。
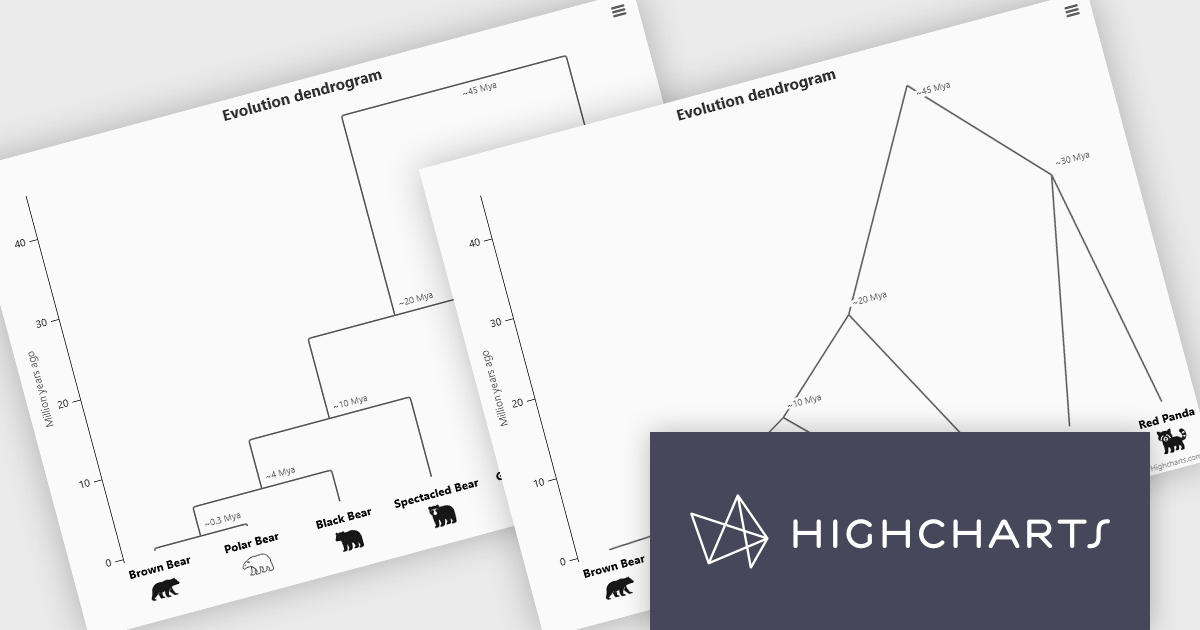
Highcharts is a JavaScript charting framework that allows web developers and data analysts to generate dynamic, visually appealing charts and graphs for websites and web applications. It can display a variety of chart types, including line, spline, area, column, bar, pie, scatter, and many more. Highcharts is well-known for its ease of use, rich documentation, and ability to handle huge datasets efficiently. Features include responsive design, accessibility support, and cross-browser compatibility. Its customization capabilities allow users to create bespoke data visualizations that increase engagement and provide insightful data presentations.
The Highcharts 12.5 update introduces dendrogram support, allowing developers to visualize hierarchical relationships and similarity levels directly within their charts using treegraph-based diagrams. This enhancement makes it easier to represent the output of hierarchical clustering algorithms, taxonomies, and other structured datasets in a clear and interpretable way. By mapping similarity or progression along an axis and using branch height to indicate relationships, developers can present complex hierarchical data more effectively.
To see a full list of what's new in 12.5, see our release notes.
Highcharts Core is licensed on an annual or perpetual basis, OEM licenses, and Advantage Renewals. It is licensed per Developer and has several license options including Internal, SaaS, SaaS+, and Self Hosted. See our Highcharts Core licensing page for full details.
Learn more on our Highcharts Core product page.

Froala Editor is a lightweight, modern WYSIWYG (What You See Is What You Get) rich text editor designed for web applications, offering a clean interface, fast performance, and extensive customization options. Built with a focus on usability and developer flexibility, it provides a wide range of formatting tools, media management capabilities, and advanced features such as inline editing, collaborative functionality, and mobile responsiveness. Its modular architecture, robust API, and broad framework integrations make it suitable for embedding into enterprise-level platforms as well as smaller applications requiring a polished content-editing experience.
The Froala v5.0.0 update introduces support for importing content directly from Microsoft Word documents. This allows users to bring in Word-authored content while keeping the original formatting, styles, and structure intact. The update removes the need for custom cleanup scripts, helping produce more reliable and consistent HTML during content transfers.
To see a full list of what's new in v5.0.0, see our release notes.
Froala Editor is licensed per product and domain. It is available as an annual or perpetual license with version upgrades and support. See our Froala Editor licensing page for full details.
For more information, visit our Froala Editor product page.
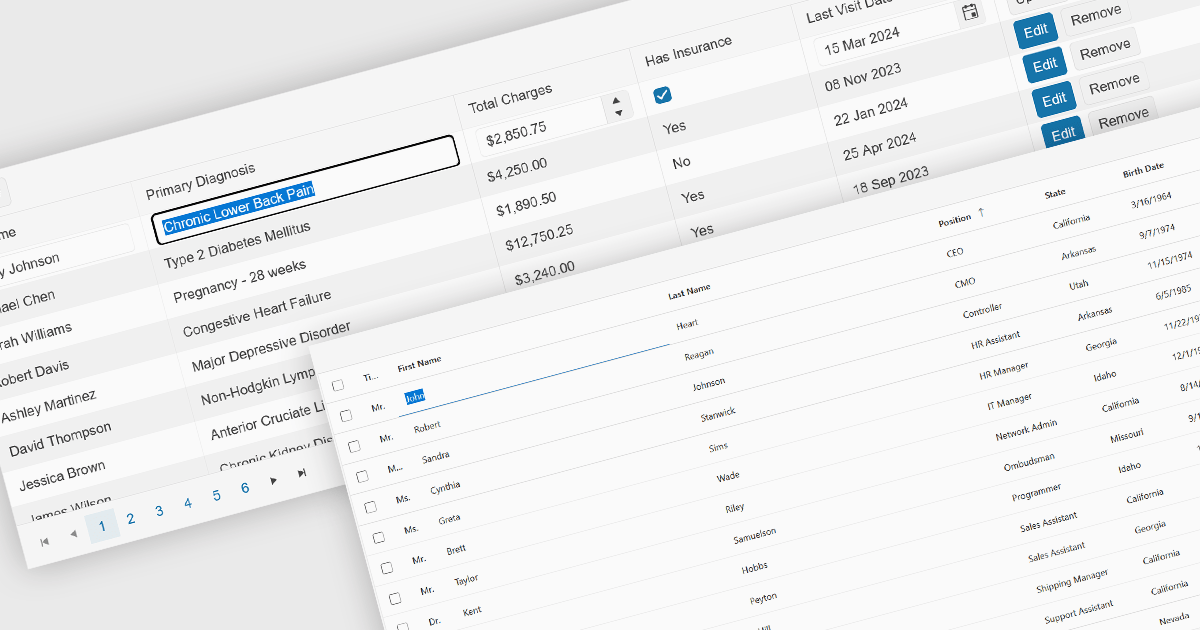
Inline editing is an essential feature of modern grid components, allowing users to create, update, and validate data directly within tabular views. By enabling edits in place, without navigating away from the grid, these features support faster data entry and improve usability in data-intensive applications such as administration panels, financial systems and line-of-business tools.
Several Angular grid controls offer inline editing features, including:
For an in-depth analysis of features and price, visit our Angular grid controls comparison.
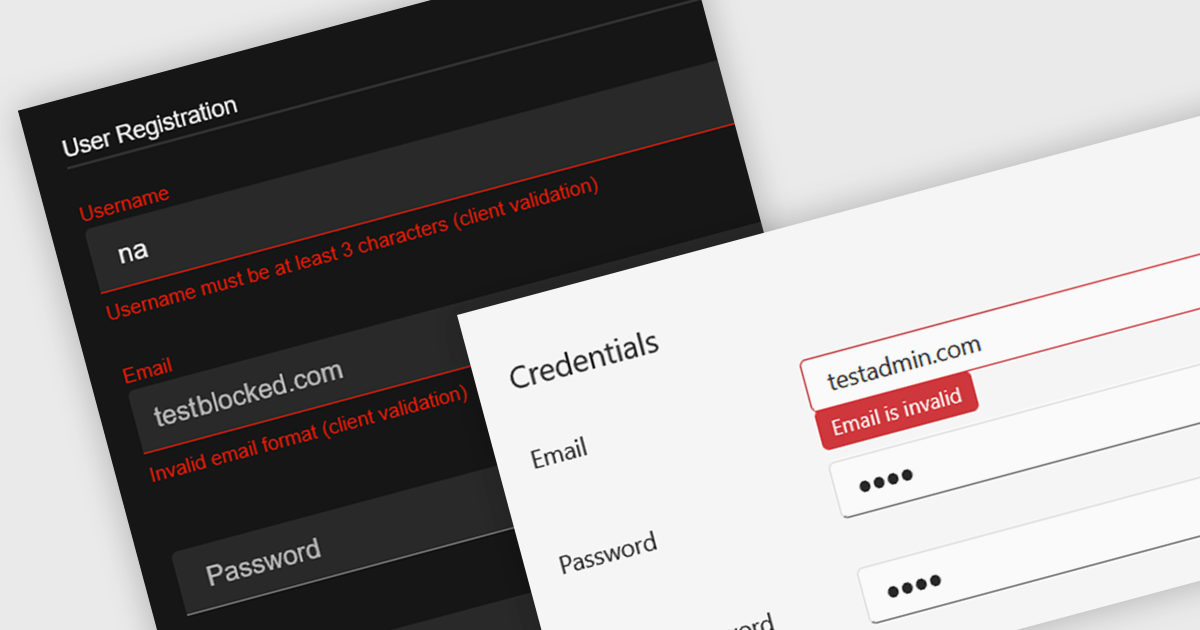
Data validation in a data editor component refers to the process of automatically checking user input against defined rules to ensure accuracy, consistency, and adherence to expected formats before the data is processed or stored. This can include checks for data types, required fields, value ranges, or pattern matching, typically enforced either on the client side for immediate feedback or on the server side for security and integrity. For software developers, incorporating data validation into a data editor improves data quality, reduces the risk of application errors, and enhances the user experience by guiding users to correct mistakes early in the input process.
Several React data editor collections provide support data validation, including:
For an in-depth analysis of features and price, visit our comparison of React data editors.
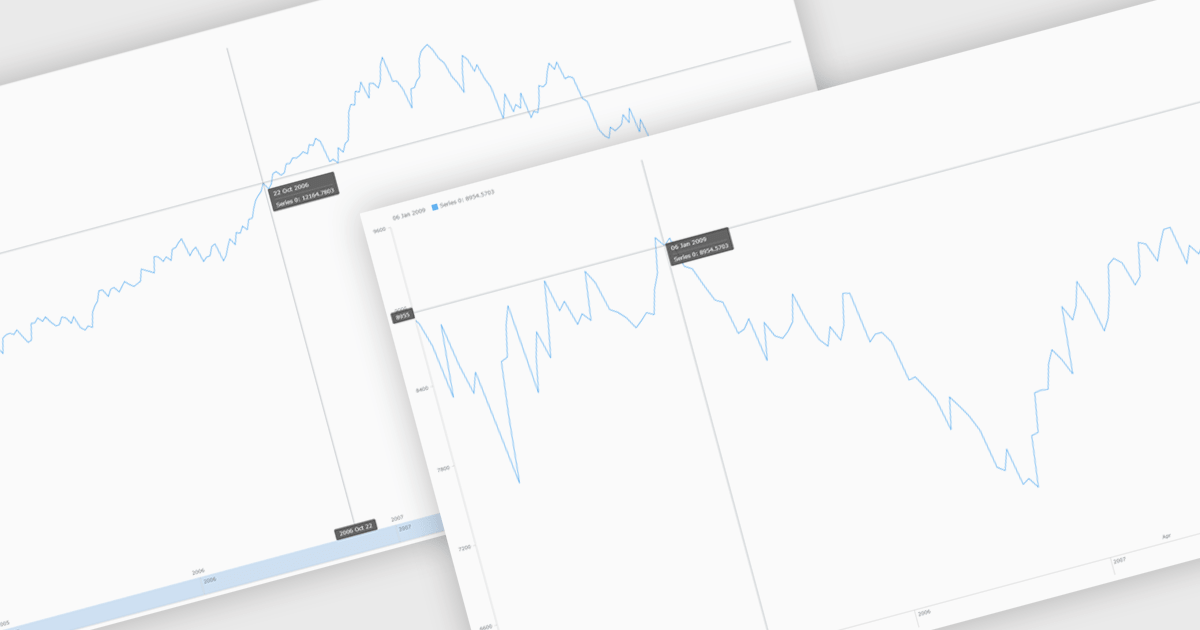
Chart zooming allows users to interactively adjust the visible range of a chart to focus on specific data points, time periods, or value ranges for closer analysis. By enabling users to zoom in and out dynamically, it reduces visual clutter, improves clarity, and helps uncover trends, anomalies, or patterns that may be difficult to identify at a full-scale view. This interactive capability supports faster, more informed decision-making by allowing movement between high-level overviews and detailed insights without reloading data. Common use cases include analyzing financial performance over specific timeframes, investigating spikes or drops in operational metrics, reviewing detailed sensor or monitoring data, and highlighting key data segments during presentations or stakeholder reviews.
Several JavaScript chart controls support zooming including:
For an in-depth analysis of features and price, visit our comparison of JavaScript Charts.
联系电话: (888) 850 9911
传真: +1 770 250 6199


