













官方供应商
我们作为官方授权经销商,直接提供超过200家开发厂家所发行超过1000个的产品授权给您。
查看我们的所有品牌。
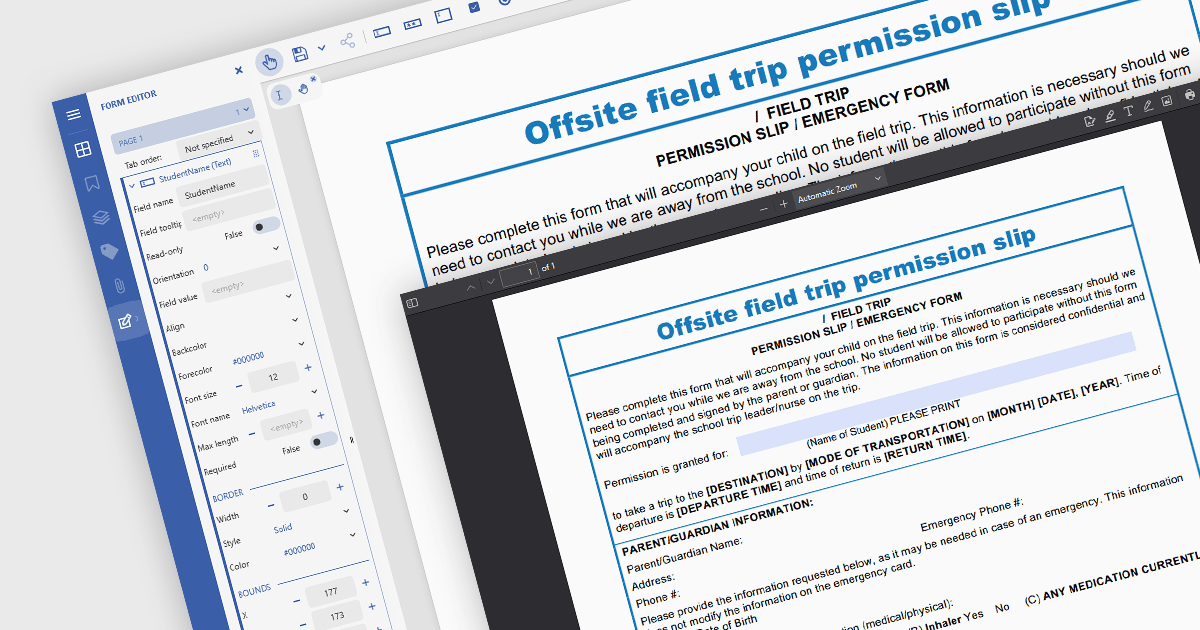
In JavaScript-based PDF viewers, the ability to add, edit, remove, and rename form fields within Acrobat-style PDF forms allows developers and users to dynamically manage form structure and content directly within the browser. This functionality enables real-time customization of interactive PDF documents without requiring external PDF editors. By supporting operations like inserting new text fields, adjusting existing ones, deleting unused fields, or updating field names to match data schemas, this feature significantly enhances the flexibility and usability of PDF forms. It benefits workflows such as document automation, digital signatures, and data collection, particularly in applications where user-driven or programmatic form manipulation is essential for tailoring documents to specific tasks or data sources.
Several JavaScript PDF viewer components allow you to add, edit and remove form fields from PDF forms, including:
For an in-depth analysis of features and price, visit our comparison of JavaScript PDF viewer components.
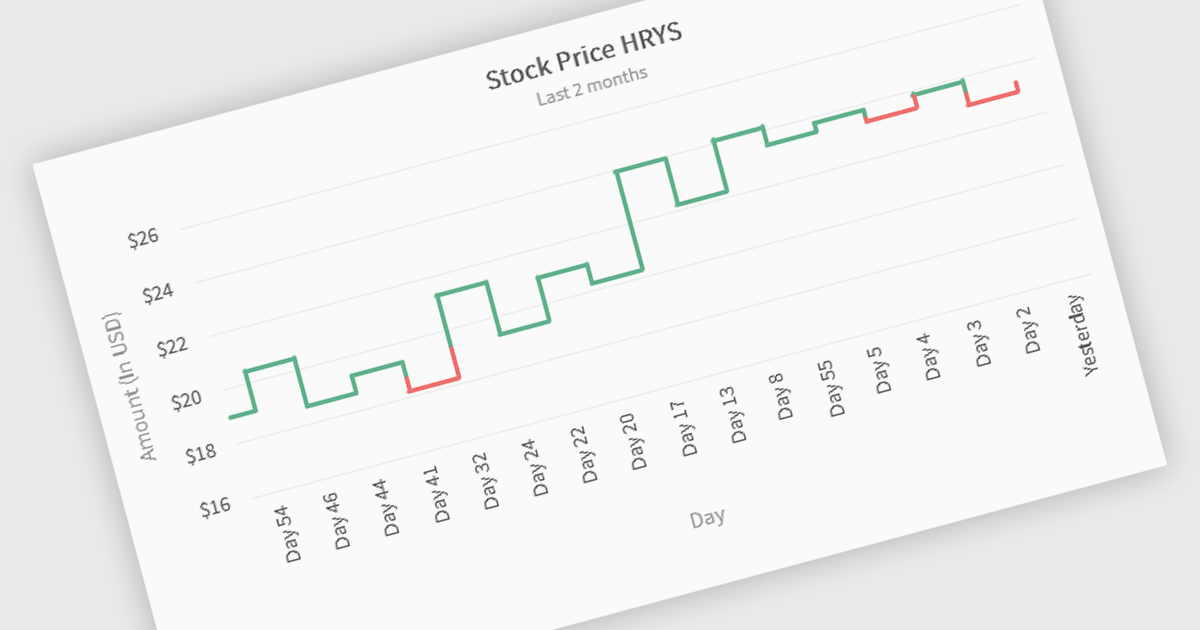
Kagi charts are a technical analysis tool that display price movement through vertical lines, ignoring time to focus on significant price changes. Thick lines indicate rising demand when prices break above previous highs, while thin lines signal increased supply when prices fall below previous lows. This clear visual format helps traders filter out noise, identify trends, and spot key breakouts or reversals. Ideal for analyzing market sentiment, Kagi charts are used across stocks, forex, and commodities to support confident, data-driven trading decisions.
Several JavaScript chart components provide Kagi charts, including:
For an in-depth analysis of features and price, visit our JavaScript charts comparison.
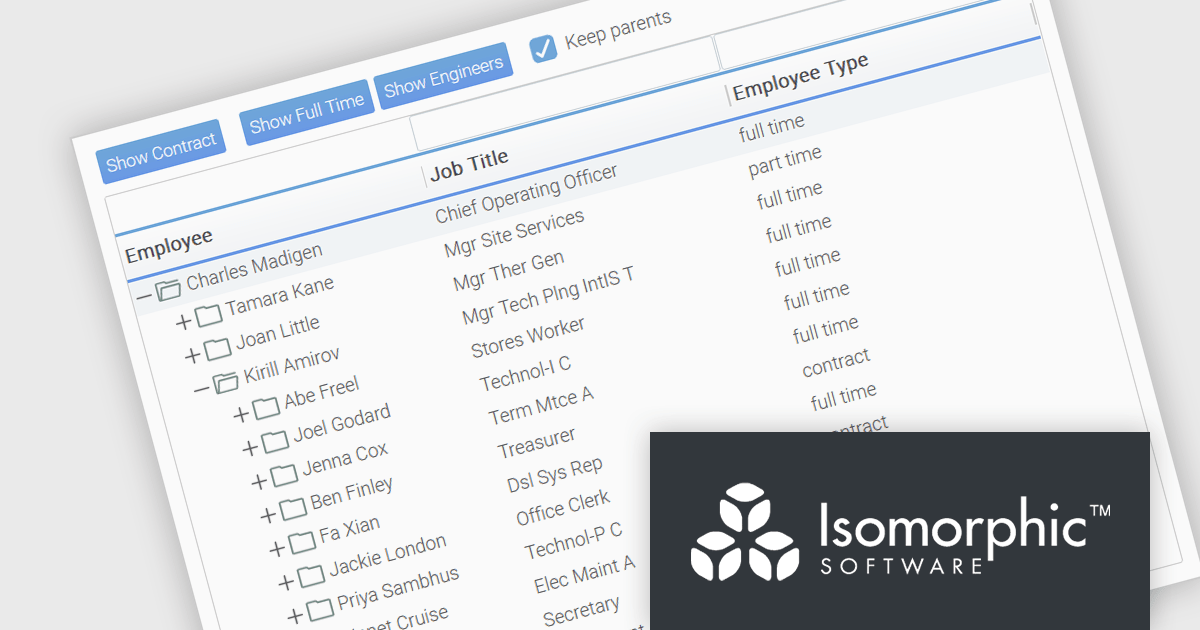
SmartClient is a powerful JavaScript component suite compatible with React, Vue, Angular, and more, designed for building large-scale, high-performance web apps. It offers advanced UI components, dynamic data handling, customizable grids, and responsive design. Ideal for enterprise use cases like financial analytics and real-time reporting, SmartClient supports seamless backend integration and delivers optimized performance and scalability.
SmartClient has enhanced hierarchical data handling with the included KeepParentsOnFilter setting, ensuring that parent nodes remain visible in filtered views, even when data is loaded dynamically. It loads "skeleton branches" via a complex client-driven algorithm, automatically managed by SmartClient, to maintain high performance without preloading the entire tree, meaning it doesn't require server-side programming. This is particularly useful in large datasets with load-on-demand trees, as it allows users to maintain full visibility into the structure of filtered results without losing context. By preserving the hierarchical path to matching records, this feature improves usability and clarity in tree-based components, especially in applications where understanding the parent-child relationship is critical.
SmartClient is licensed per developer and is available as both perpetual and subscription licenses. Product updates and technical support is also available. See our SmartClient licensing page for full details.
For more information, visit our SmartClient product page.
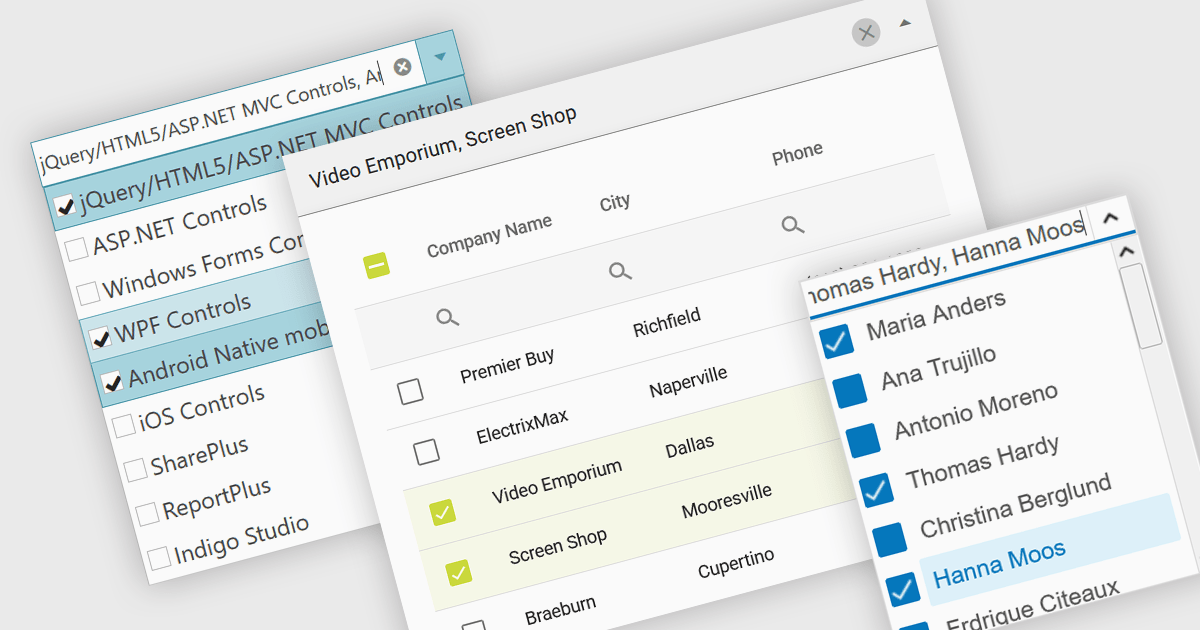
A checked combobox is a data editor component used in user interfaces that consists of a text box with a drop-down panel. This panel displays a predefined list of items, in a clean and organized layout, from which users can input data by making a singular or multiple selections using the adjacent checkboxes. The values are then typically displayed as a comma-separated summary in the collapsed field. This type of control provides developers with a convenient way to implement multi-select functionality within their applications, and is especially effective in scenarios such as filtering datasets or configuring settings, without consuming additional space on the interface.
Several jQuery data editor collections include checked comboboxes, including:
For an in-depth analysis of features and price, visit our comparison of jQuery data editors.
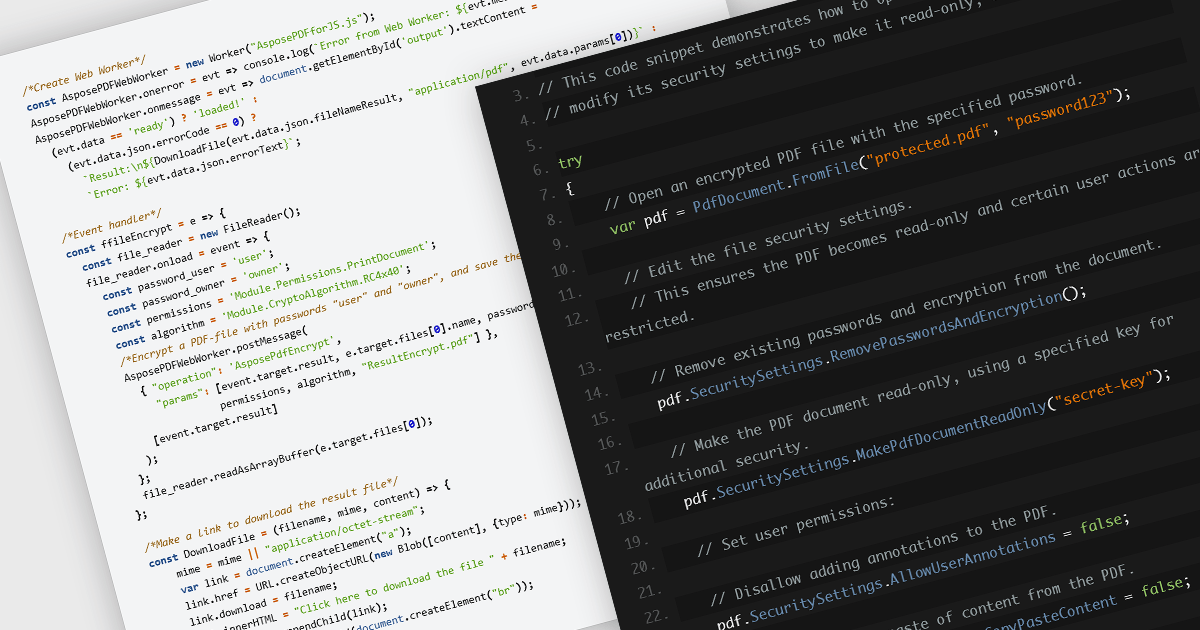
Encrypting and decrypting PDF files is a key feature in many modern PDF components, allowing developers to protect sensitive information and control access to documents. Encryption applies a security layer to the PDF, typically requiring a password to open or modify the file, while decryption reverses the process for authorized users. These capabilities are essential for applications that handle confidential business data, legal documents, or personal records, ensuring compliance with security policies and data protection regulations.
Several JavaScript PDF controls offer the ability to encrypt or decrypt PDF files including:
For an in-depth analysis of features and price, visit our JavaScript PDF controls comparison.
联系电话: (888) 850 9911
传真: +1 770 250 6199


