













官方供应商
我们作为官方授权经销商,直接提供超过200家开发厂家所发行超过1000个的产品授权给您。
查看我们的所有品牌。

TreeLists in UI suites are specialized components designed to display hierarchical, self-referencing data in a tabular format with expandable and collapsible rows. They combine the structure of a tree view with the functionality of a data grid, offering built-in features such as sorting, filtering, editing, and paging. This makes them ideal for scenarios where complex relationships must be presented clearly, such as organization charts, project task structures, file directories, or product categories. Their intuitive layout and powerful data management capabilities help streamline workflows and enhance the user experience in enterprise and business applications.
Several jQuery UI suites feature a treelist control including:
For an in-depth analysis of features and price, visit our jQuery UI Suites comparison.

Rectangle annotations in PDF viewer components enable users to highlight, mark, or comment on specific areas within a PDF document by drawing rectangular shapes. This feature is commonly used for reviewing documents, collaborating on content, or emphasizing sections in technical or legal workflows. It enhances user interactivity within the viewer, allowing for visual references and context-specific notes without altering the original document content.
Several React PDF viewer controls offer rectangle annotations including:
For an in-depth analysis of features and price, visit our React PDF viewer controls comparison.
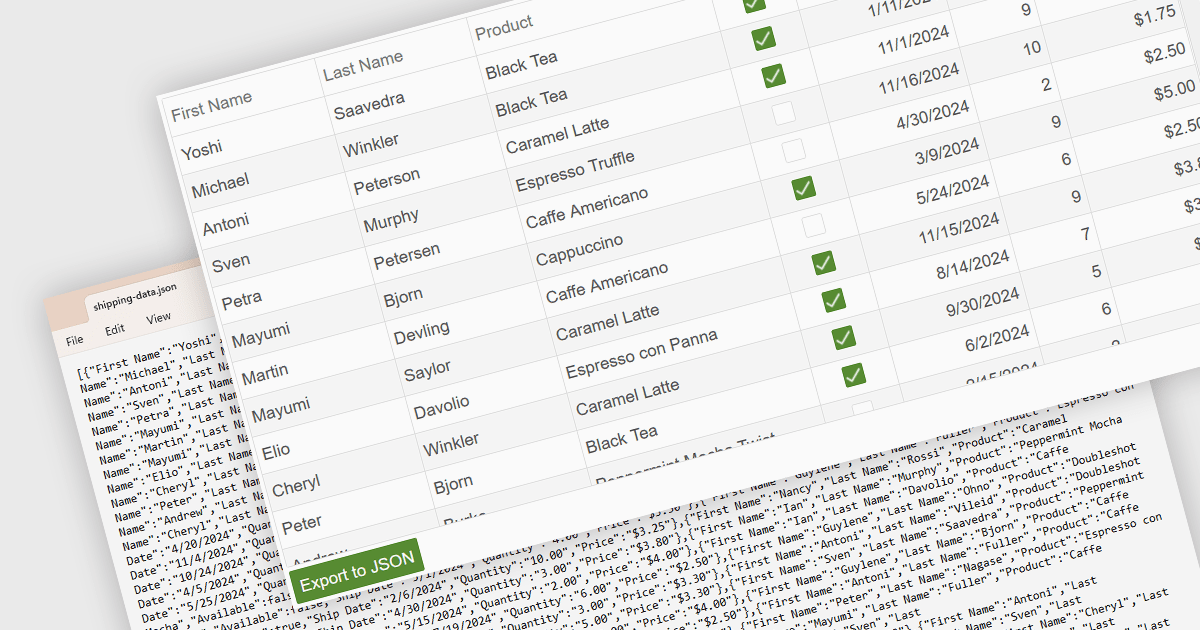
Exporting a data grid to JSON format is a common feature in modern web-based data tools that involves converting the structured data displayed in a grid, such as rows and columns representing records and fields, into JavaScript Object Notation (JSON), a lightweight, text-based format commonly used for data interchange. This process enables the grid's contents to be saved in a machine-readable structure that preserves the hierarchy and attributes of the data, making it easily consumable by web services, APIs, or other applications. The benefits of exporting to JSON include its compatibility with a wide range of programming environments, ease of integration with frontend and backend systems, and suitability for transmitting data across networked systems or persisting it for later use in client-side operations or remote storage.
Several Vue.js grid controls allow you to export to JSON, including:
For an in-depth analysis of features and price, visit our comparison of Vue.js grid controls.
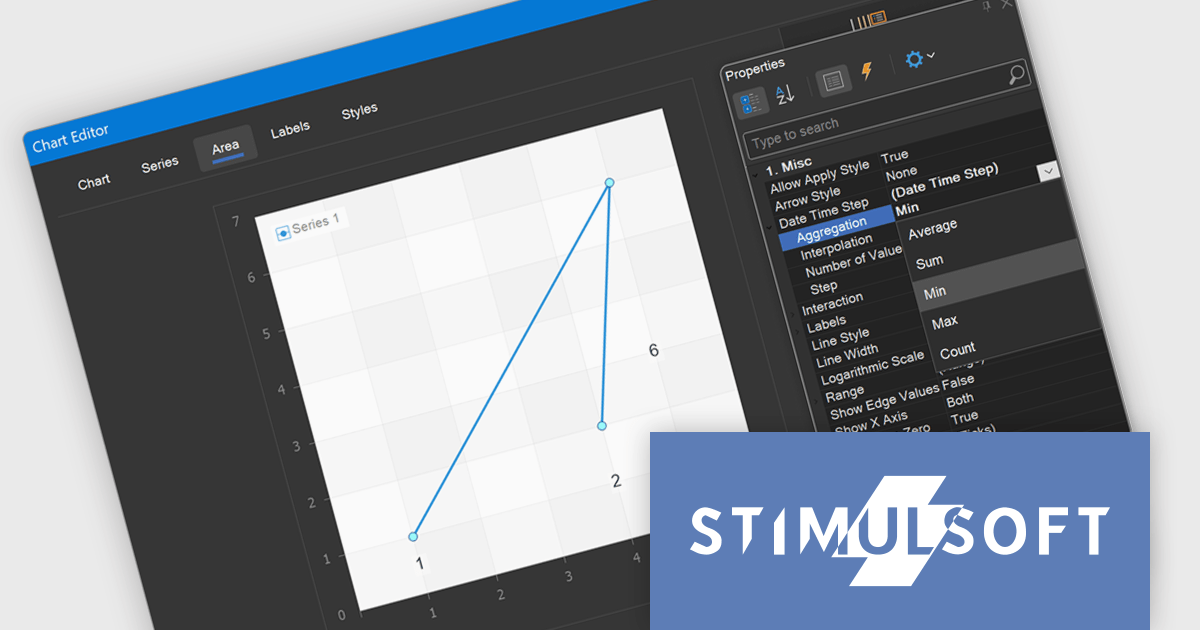
Stimulsoft Reports.JS provides a robust reporting toolkit designed specifically for JavaScript applications. This library leverages a client-side architecture, offering a pure JavaScript report engine for efficient report rendering directly within web browsers. The solution includes a user-friendly report designer for building reports with various data sources and visualizations, along with a report viewer for seamless integration and display within your JavaScript applications. This eliminates the need for server-side dependencies or browser plugins, simplifying the development process for embedding powerful reporting functionalities into your web projects.
Stimulsoft Reports.JS now supports aggregation for Date Time Step, allowing developers to select from multiple data aggregation functions including Average, Sum, Min, Max, and Count. This enhancement provides greater control over how time-based data is grouped and displayed in report charts, enabling more accurate and relevant visualizations based on the specific nature of the dataset. By choosing the appropriate aggregation method, developers can optimize performance reporting, reveal insights more effectively, and better align visual outputs with analytical requirements.
Stimulsoft Reports.JS is licensed per developer and is available as a Perpetual license with 1 year support and maintenance. See our Stimulsoft Reports.JS licensing page for full details.
Stimulsoft Reports.JS is available individually or as part of Stimulsoft Ultimate.

DevExtreme Complete is a robust suite of tools by DevExpress designed to streamline the development of high-performance web applications. It includes a wide range of UI components for modern frameworks such as Angular, React, Vue, and jQuery, making it ideal for developers aiming to create responsive, cross-platform applications with ease. With features like rich data visualization, interactive grids, form controls, and adaptive layouts, it empowers developers to deliver polished and user-friendly interfaces. Whether you're building enterprise dashboards or consumer-facing apps, DevExtreme Complete provides the flexibility and power to meet complex requirements while maintaining performance and usability.
The DevExtreme Complete v25.1 release adds a new CardView component, which presents data in a card-based layout instead of the traditional grid format. It’s particularly suited to use cases like employee directories, contact lists, product catalogs, and task boards - any scenario where visual content such as images plays a central role. Each card includes a toolbar, cover image, main content area, and footer, all of which can be modified using the component's public API. This gives developers the flexibility to adapt the layout and behavior of CardView to meet specific application requirements.
To see a full list of what's new in version v25.1, see our release notes.
DevExtreme Complete is licensed per developer and is available as a Perpetual License with a 12 month support and maintenance subscription. See our DevExtreme Complete licensing page for full details.
DevExtreme Complete is available to buy individually or as part of the following products:
联系电话: (888) 850 9911
传真: +1 770 250 6199


