













官方供应商
我们作为官方授权经销商,直接提供超过200家开发厂家所发行超过1000个的产品授权给您。
查看我们的所有品牌。
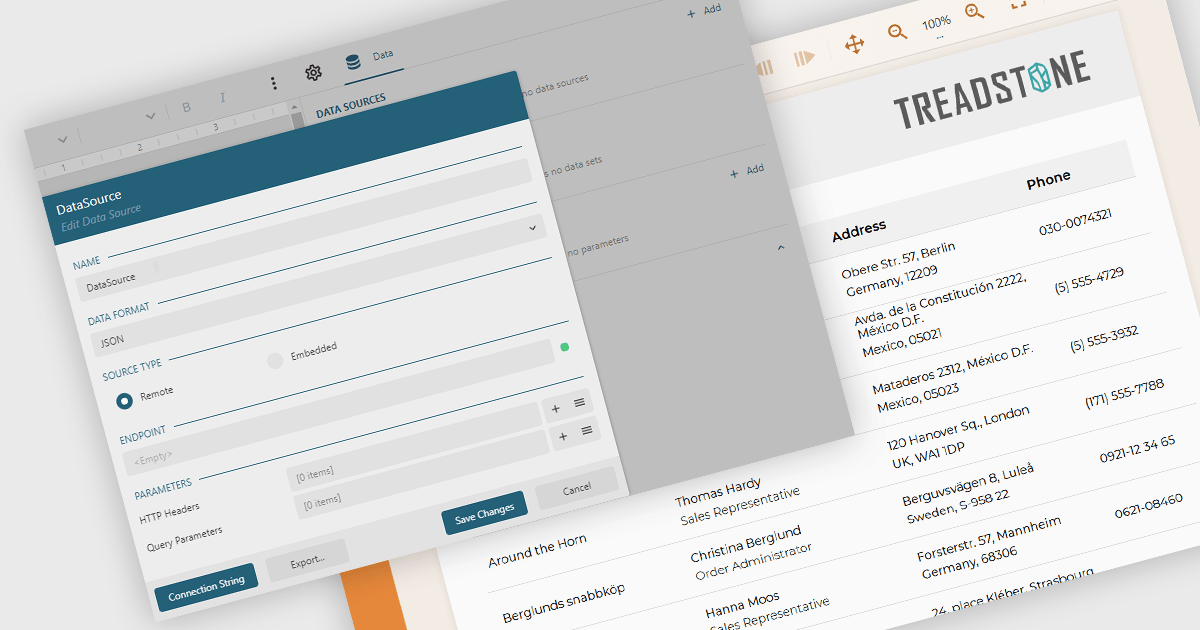
JSON data connectivity in reporting components provides the ability to use JSON (JavaScript Object Notation) data as a primary source for building and generating reports. This feature allows developers and analysts to connect directly to structured JSON data, whether from local files or web APIs, and incorporate it into report designs without the need for complex data transformation or intermediary storage. As JSON has become a widely adopted format for data exchange in modern applications, enabling direct connectivity simplifies the reporting process and ensures that reports can easily reflect up-to-date information from diverse and distributed sources.
Several JavaScript reporting components allow you to use JSON as a data source, including:
For an in-depth analysis of features and price, visit our comparison of JavaScript reporting components.
SurveyJS is a family of extensible JavaScript libraries designed to help developers build robust form management systems fully integrated into their web applications. These libraries work seamlessly with any backend system and are fully compatible with modern JavaScript frameworks, including React, Angular, and Vue.
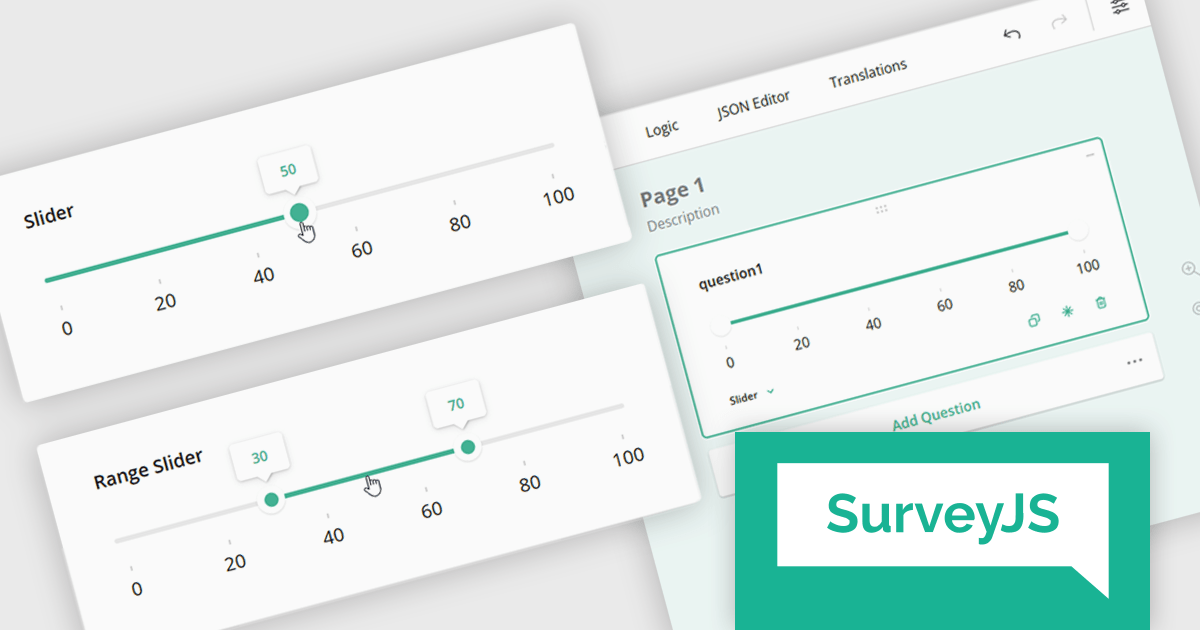
The SurveyJS 2.2.0 update introduces new Slider and Range Slider question types that enable developers to implement more interactive and precise input mechanisms within surveys. These components support a wide range of configuration options, including customizable minimum and maximum values, step sizes, labeled scales, and tooltip formatting. The Range Slider further enhances flexibility by allowing respondents to select and drag a value range using dual thumbs, with optional constraints on range length. Both question types can be seamlessly bound to text input fields, offering a more responsive and accessible data collection experience in custom survey workflows.
To see a full list of what's new in version 2.2.0, see our release notes.
SurveyJS is licensed per developer with a one-time payment for indefinite use. Access to updates and technical support is available through a subscription. See our SurveyJS Survey Creator licensing page for full details.
Learn more on our SurveyJS Survey Creator product page.
OptimaJet is a global software vendor dedicated to providing developer-centric tools that streamline enterprise application development. Since 2013, the company has supported organizations across industries such as finance, government, logistics, and insurance. With offices in the United States and Hong Kong, OptimaJet delivers scalable, cost-effective solutions designed to accelerate development and adapt to changing business needs.
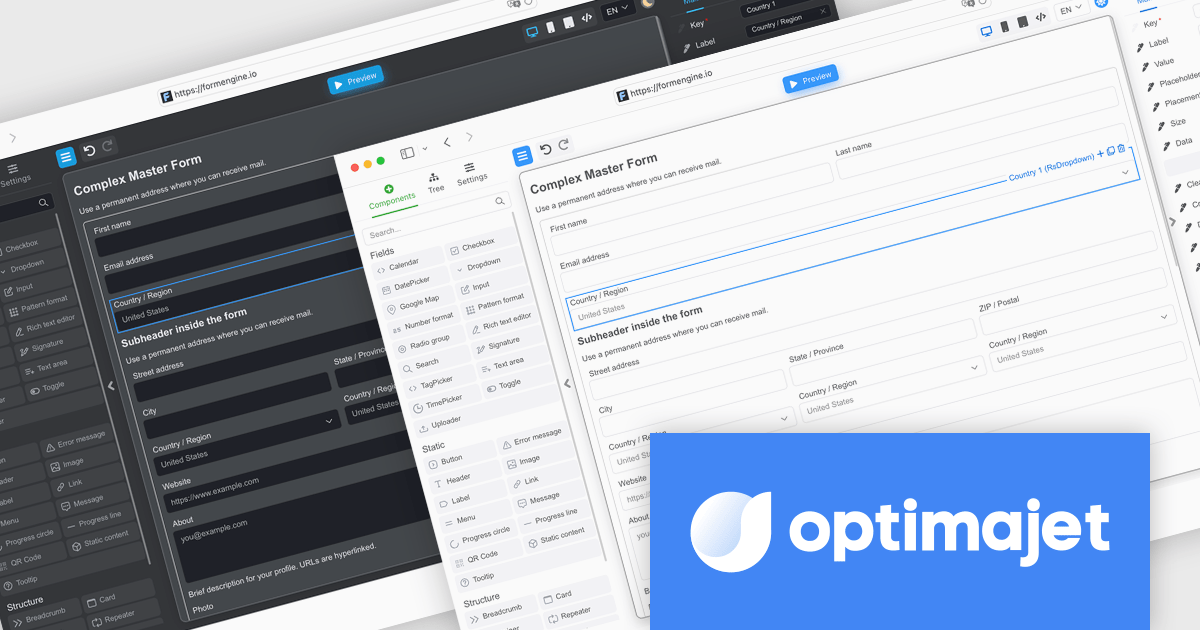
FormEngine is a powerful React-based drag-and-drop form builder that enables visual creation of complex web forms without the need for frontend coding. Forms are stored as JSON and rendered dynamically at runtime, allowing teams to build and update forms quickly while maintaining full control over structure and data flow. It is ideal for internal business tools, onboarding processes, and any application requiring flexible, frequently updated forms.
Through this partnership, ComponentSource extends its portfolio with a modern React-based solution that supports developers in building adaptive, data-driven forms with ease. Offering OptimaJet's FormEngine reflects ComponentSource’s ongoing commitment to equipping development teams with high-quality tools that simplify complex tasks, accelerate delivery, and enhance the flexibility of enterprise applications.
FormEngine, by OptimaJet, is licensed based on usage type, number of domains, and included components, with options for internal use, SaaS deployment, or OEM integration. See our FormEngine licensing page for full details.
For more information visit our OptimaJet brand page.
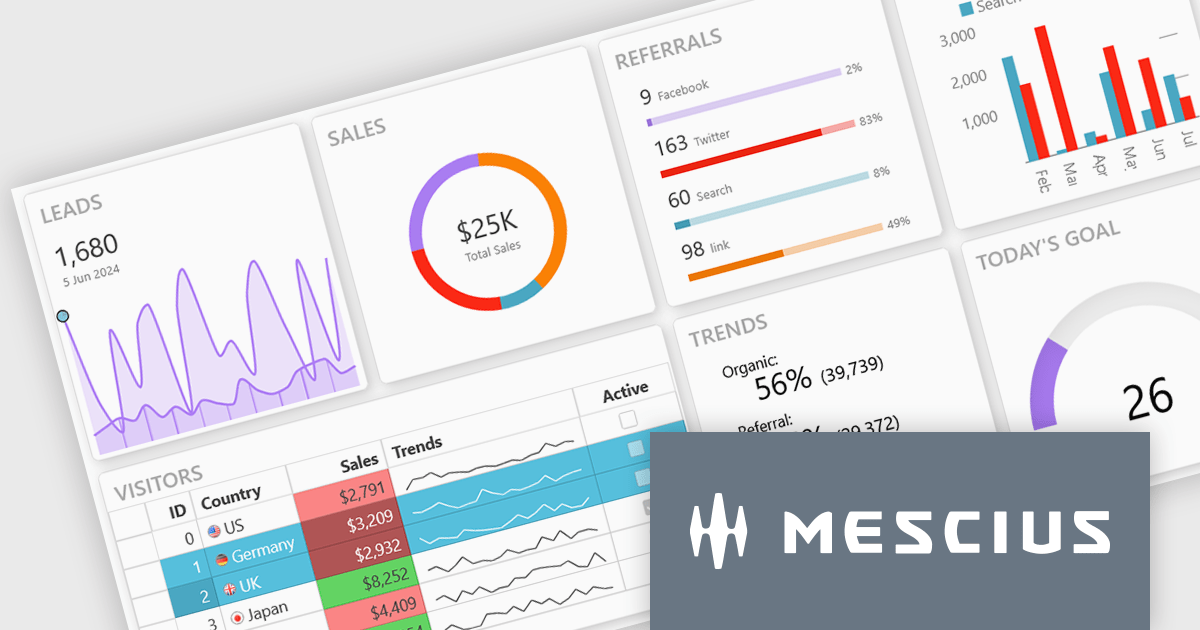
Wijmo is a complete collection of extensible, fast, flexible JavaScript UI components written in TypeScript. The framework-agnostic Wijmo components include first-class support for top frameworks including Angular, React, Vue and Web Components. Wijmo Enterprise has over 100 dynamic JavaScript UI components to help cut your development time in half and build lightweight, high-performance JavaScript applications using your favorite JavaScript framework.
On June 25, 2025 at 11:00 AM EDT, MESCIUS (formerly GrapeCIty) will be presenting a CodeClinic Live Webinar, exploring the 25 UX laws to give your apps an advantage over the competition. Learn why they are important, how to follow the industry's best practices, and how to apply them, assessing various popular web applications.
Register for the LIVE webinar today, and mark your calendar for June 25.
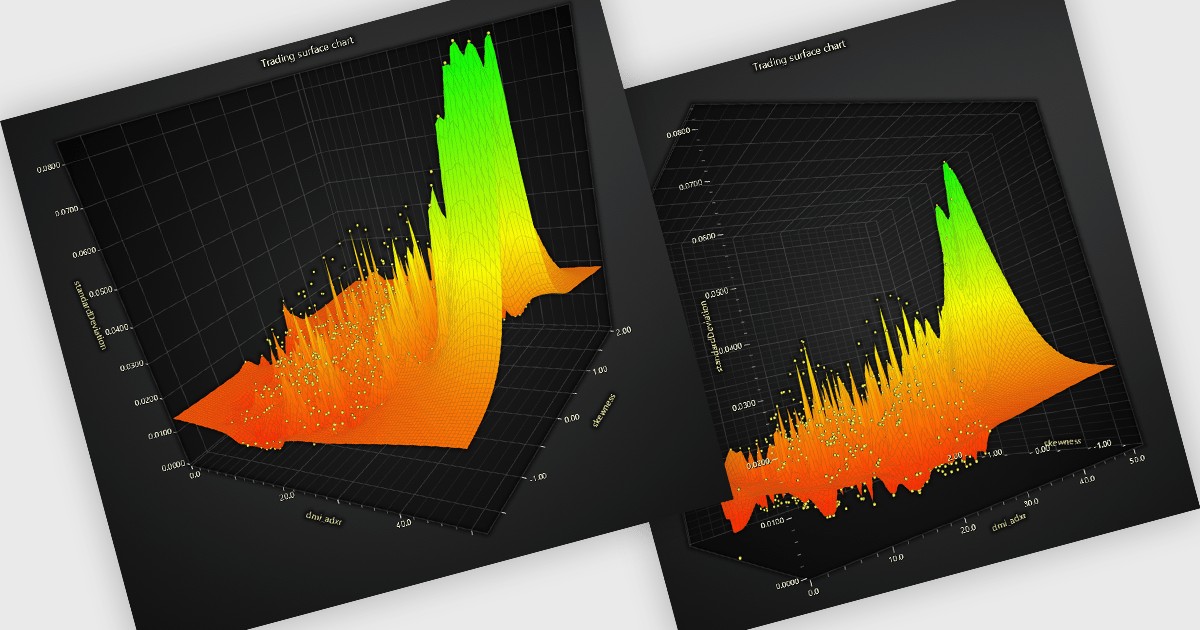
A surface chart is a powerful data visualization tool used to represent three-dimensional data, where the relationships between three numerical variables are plotted across a surface. By mapping values on the X, Y, and Z axes, and optionally applying dynamic color gradients to introduce a fourth variable, surface charts reveal patterns and correlations not easily detected in 2D charts. This makes them particularly valuable in fields such as engineering, scientific research, and finance. The ability to interpret multiple data dimensions simultaneously enables clearer insights and supports more informed, data-driven decisions.
Several JavaScript chart controls offer Surface Charts including:
For an in-depth analysis of features and price, visit our JavaScript chart controls comparison.
联系电话: (888) 850 9911
传真: +1 770 250 6199


