


官方供应商
我们作为官方授权经销商,直接提供超过200家开发厂家所发行超过1000个的产品授权给您。
查看我们的所有品牌。
Syncfusion Essential Studio JavaScript is a comprehensive UI library offering over 80 high-performance, lightweight, and responsive components to transform your web apps. Built from scratch with TypeScript, it boasts modularity and touch-friendliness, letting you pick and choose specific features while ensuring smooth mobile interaction. With rich themes, global accessibility features, and extensive documentation, it powers everything from basic buttons to interactive charts and data grids, simplifying frontend development across JavaScript, Angular, React, and Vue.
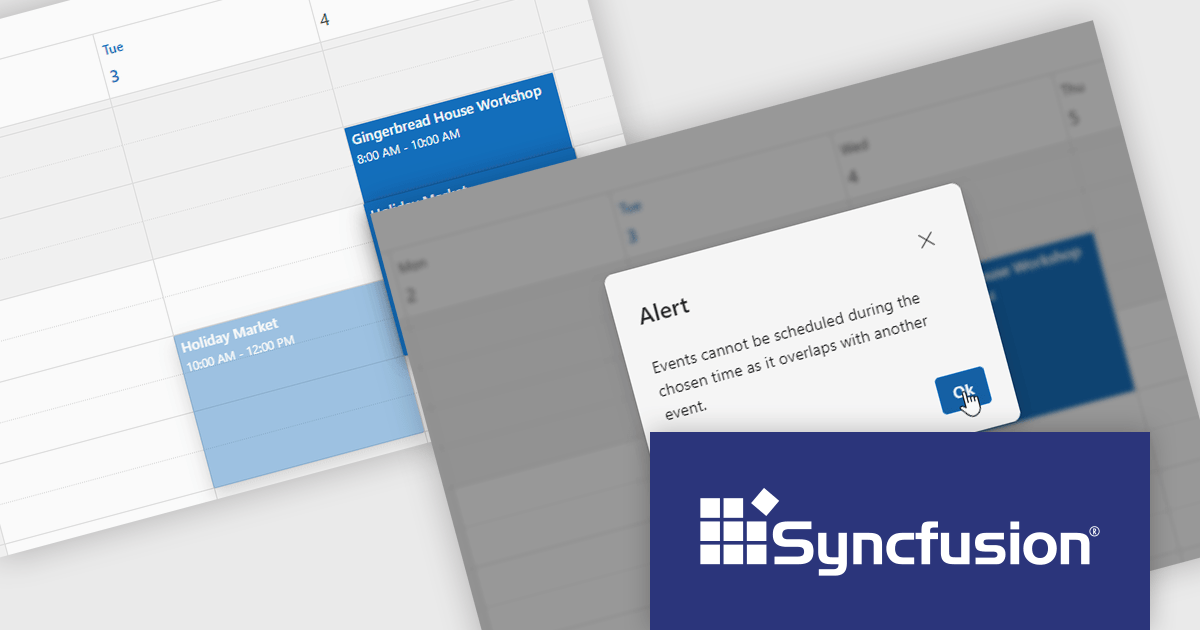
The Syncfusion Essential Studio JavaScript 2025 Volume 1 release adds a new feature to the Scheduler component to prevent overlapping appointments by setting the allowOverlap property to false. This enhancement ensures that users cannot schedule multiple events at the same time slot, thereby maintaining a clear and organized calendar.
To see a full list of what's new in 2025 Volume 1, see our release notes.
Syncfusion Essential Studio JavaScript is available as part of Syncfusion Essential Studio Enterprise which is licensed per developer starting with a Team License of up to five developers. It is available as a 12 Month Timed Subscription License which includes support and maintenance. See our Syncfusion Essential Studio Enterprise licensing page for full details.
Learn more on our Syncfusion Essential Studio JavaScript product page.
DevExpress BI Dashboard (part of DevExpress Universal) empowers you to craft interactive dashboards for desktop, web and mobile applications. It provides a visual designer for building dashboards without writing code, allowing you to drag-and-drop various data visualization widgets onto the canvas. These widgets connect to your data sources and update dynamically, offering real-time insights to end users. The tool also supports customization through properties and events, enabling you to tailor the look and feel of the dashboards to perfectly integrate with your application's design.
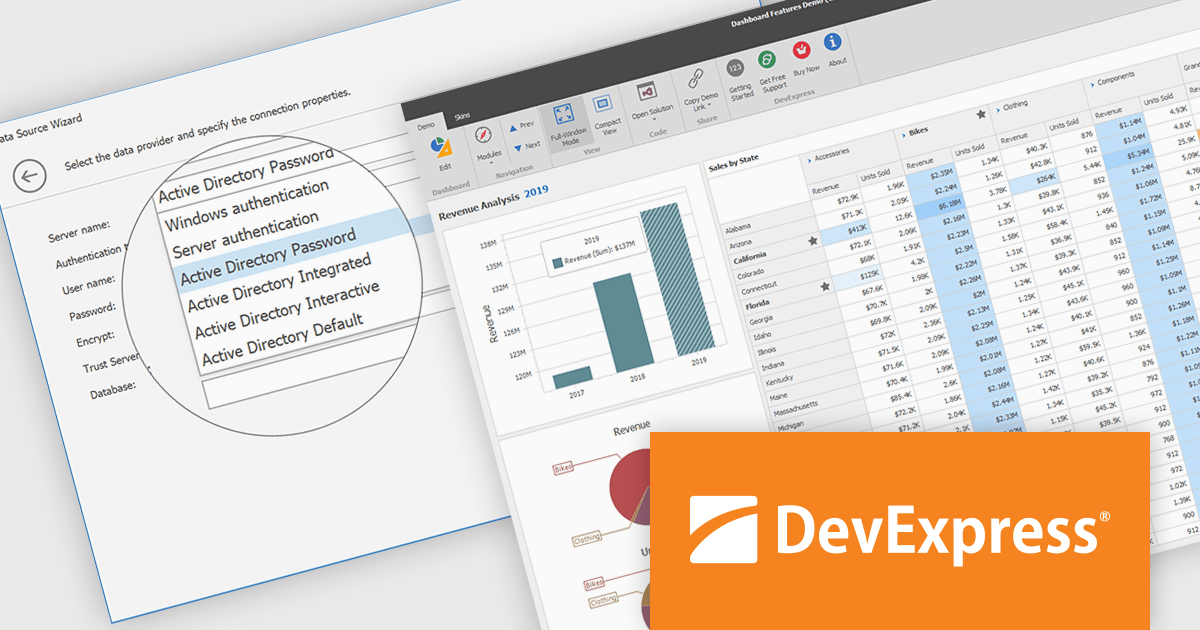
The DevExpress BI Dashboard 24.2 update enhances data security and simplifies connectivity by integrating Microsoft Entra authentication for Azure SQL databases. This update allows developers to use modern Active Directory-based authentication methods, such as ActiveDirectoryPassword, ActiveDirectoryIntegrated, ActiveDirectoryInteractive, and ActiveDirectoryDefault, ensuring that access to critical data is both secure and compliant with current enterprise standards.
To see a full list of what's new in version 24.2, see our release notes.
DevExpress BI Dashboard is included as part of DevExpress Universal which is licensed per developer and is available as a Perpetual License with a 12 month support and maintenance subscription. See our DevExpress Universal licensing page for full details.
DevExpress BI Dashboard is available in the following products:
Wijmo by MESCIUS is a comprehensive JavaScript library offering a suite of high-performance UI components and data grids specifically designed to streamline the development of modern enterprise applications. It emphasizes reduced development time and improved maintainability, along with a focus on performance through its efficient design and small module size. Wijmo integrates seamlessly with popular JavaScript frameworks like Angular, React, and Vue.js, and supports cutting-edge technologies like TypeScript, making it a versatile solution for building complex web applications.
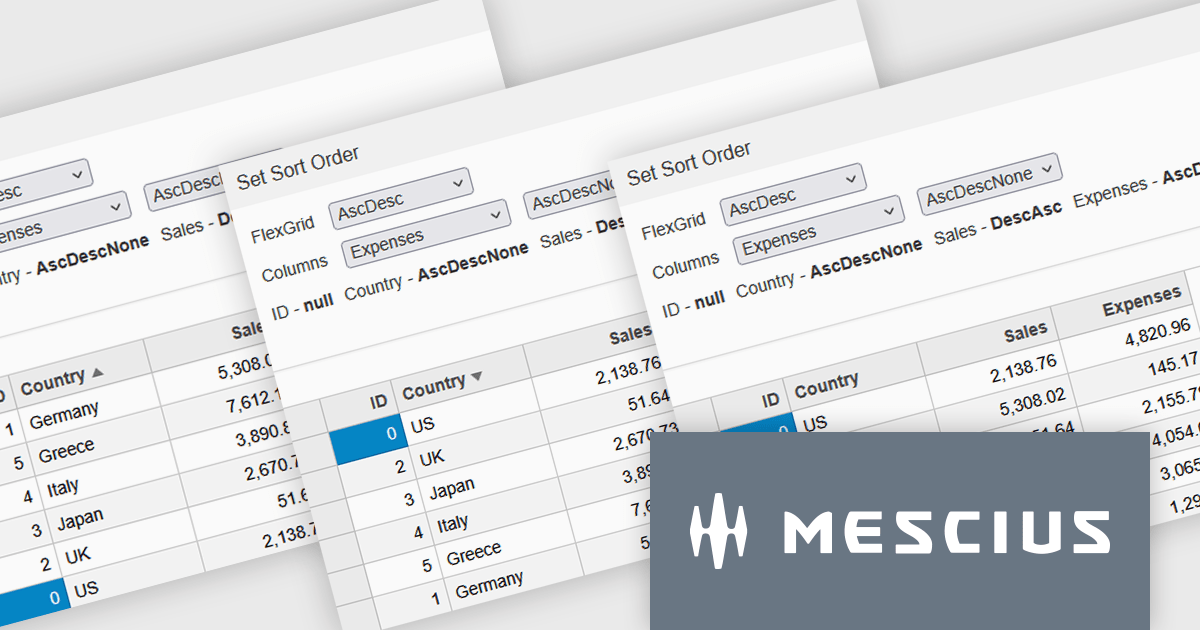
Wijmo introduces enhanced grid sorting functionality within the FlexGrid control, providing developers with the capability to implement tri-state column sorting. This allows users to cycle through ascending, descending, and unsorted states with successive clicks on column headers, offering more granular control over data arrangement. This refined sorting mechanism improves the user experience in data-intensive applications by enabling more flexible and intuitive data exploration, ultimately leading to more efficient data analysis and manipulation within the grid interface.
Wijmo is licensed per developer. Developer Licenses are perpetual and include 1 year Subscription which provides upgrades, including bug fixes and new features. See our Wijmo licensing page for full details.
Learn more on our Wijmo product page.
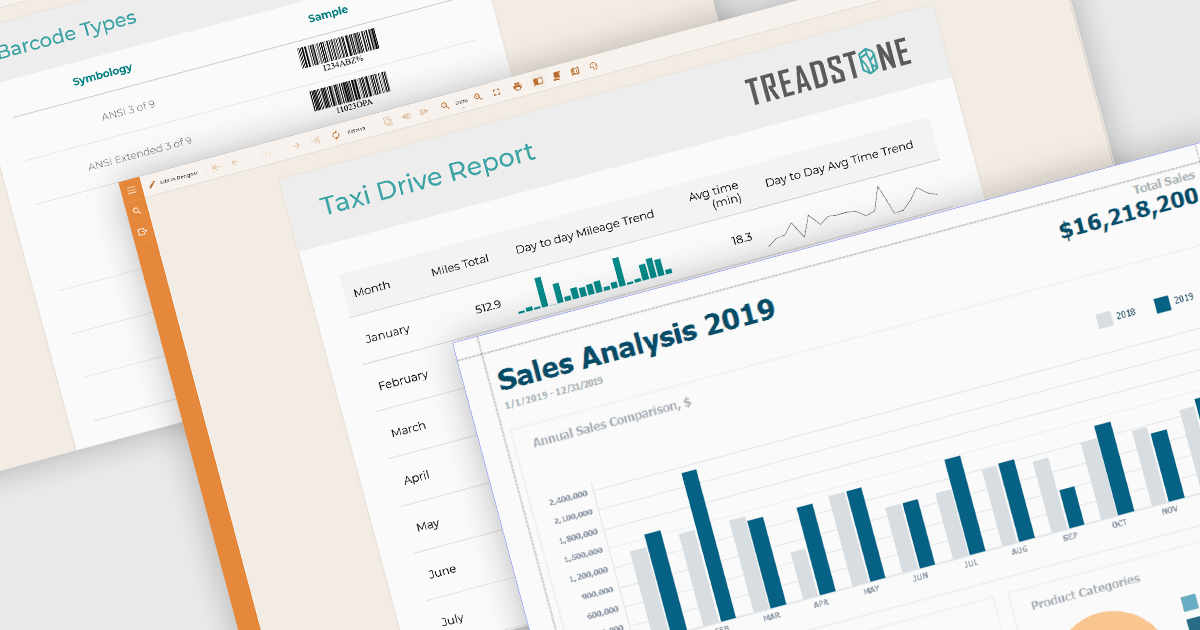
Data visualization plays a central role in reporting components by translating complex datasets into visual formats that are easier to understand and analyze. These tools help users identify patterns, monitor performance, and communicate key information at a glance. By integrating visuals directly into reports, organizations can enhance readability, support data-driven storytelling, and improve overall user engagement.
Common features include:
For an in-depth analysis of features and price, visit our Angular reporting components comparison.
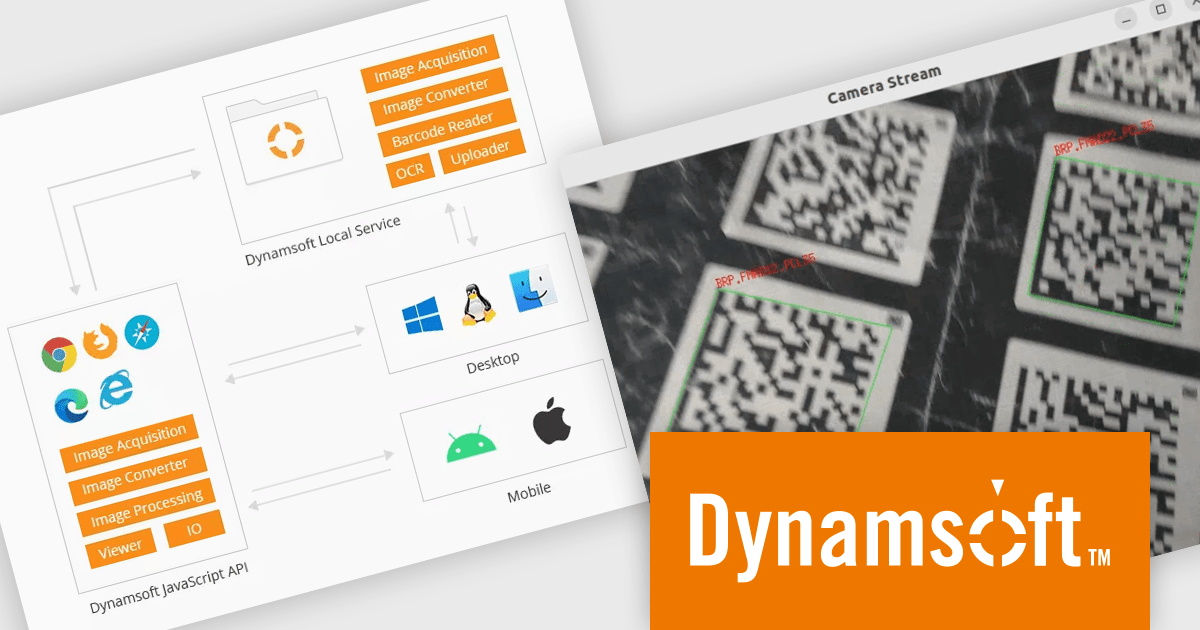
Dynamic Web TWAIN by Dynamsoft is a Software Development Kit (SDK) that simplifies adding document scanning capabilities to your web applications. It offers cross-platform and cross-browser compatibility, allowing users to scan directly from various scanners and webcams using popular browsers like Chrome and Firefox. With just a few lines of JavaScript code, you can integrate powerful scanning features into your web applications, streamlining document management workflows.
The Dynamsoft Dynamic Web TWAIN v19 update enhances its Barcode Reader Add-On by introducing support for macOS and Linux. This expansion enables barcode reading within scanning applications on platforms that were previously unsupported. By allowing developers to maintain a single codebase for barcode functionality across multiple desktop environments, it increases development efficiency and offers greater flexibility for users who prefer macOS or Linux.
To see a full list of what's new in version 19.0, see our release notes.
Dynamic Web TWAIN is licensed per Client Device and is available as an Annual license. See our Dynamic Web TWAIN licensing page for full details.
For more information, visit our Dynamic Web TWAIN product page.
联系电话: (888) 850 9911
传真: +1 770 250 6199


