













官方供应商
我们作为官方授权经销商,直接提供超过200家开发厂家所发行超过1000个的产品授权给您。
查看我们的所有品牌。

SpreadJS by MESCIUS is a high-performance JavaScript spreadsheet component designed to seamlessly integrate Excel-like functionality into web applications. It empowers developers to deliver robust spreadsheet experiences within their applications, complete with features like data import/export, complex formulas, conditional formatting, and extensive customization options. SpreadJS caters to a wide range of use cases, from financial modeling and data analysis to project management and interactive dashboards, ultimately allowing developers to build feature-rich and user-friendly web applications.
In this blog post, MESCIUS Product Manager Kevin Ashley shows you how to use the powerful and extensible SpreadJS component to import and export Excel files. Steps include:
Detailed source code is included and you can also download the sample app.
Read the full blog to get starting working directly with Excel files in your Blazor applications.
SpreadJS is licensed per developer and includes 1 Year Maintenance (major and minor version releases and unlimited support phone calls). SpreadJS requires an Annual or Perpetual Deployment License. The optional Add-ons are available at an additional cost, and require a SpreadJS license. See our SpreadJS licensing page for full details.
For more information, visit our SpreadJS product page.
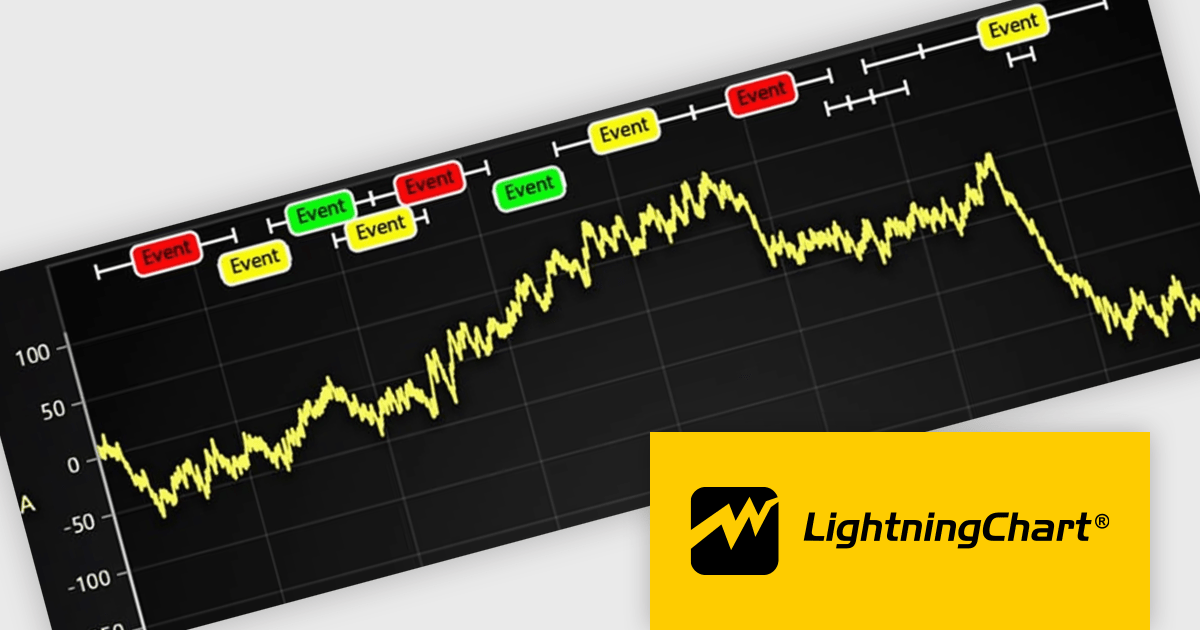
LightningChart JS is a JavaScript/TypeScript library developed by LightningChart that specifically targets the creation of financial and trading applications. It provides high-performance, 2D, 3D, and real-time charting controls and a comprehensive suite of visualizations including candlestick, bar, line, and various technical indicators and drawing tools. This library enables software developers to craft interactive technical analysis tools without the need for server-side setup as it runs completely on the client device.
The LightningChart JS v7.0.1 update introduces the Text Series API, providing a more efficient and flexible way to render text within ChartXY. This new approach enhances performance by optimizing text rendering, supports viewport clipping to maintain clean chart visuals, and offers precise control over text size and boundaries. Designed as a more seamless alternative to chart.addUIElement(), it simplifies development by integrating text elements directly within the chart while ensuring scalability for large datasets.
To see a full list of what's new in v7.0.1, see our release notes.
LightningChart JS is licensed per developer and is available as an annual license with 1 year support. See our LightningChart JS licensing page for full details.
For more information, see our LightningChart JS product page.
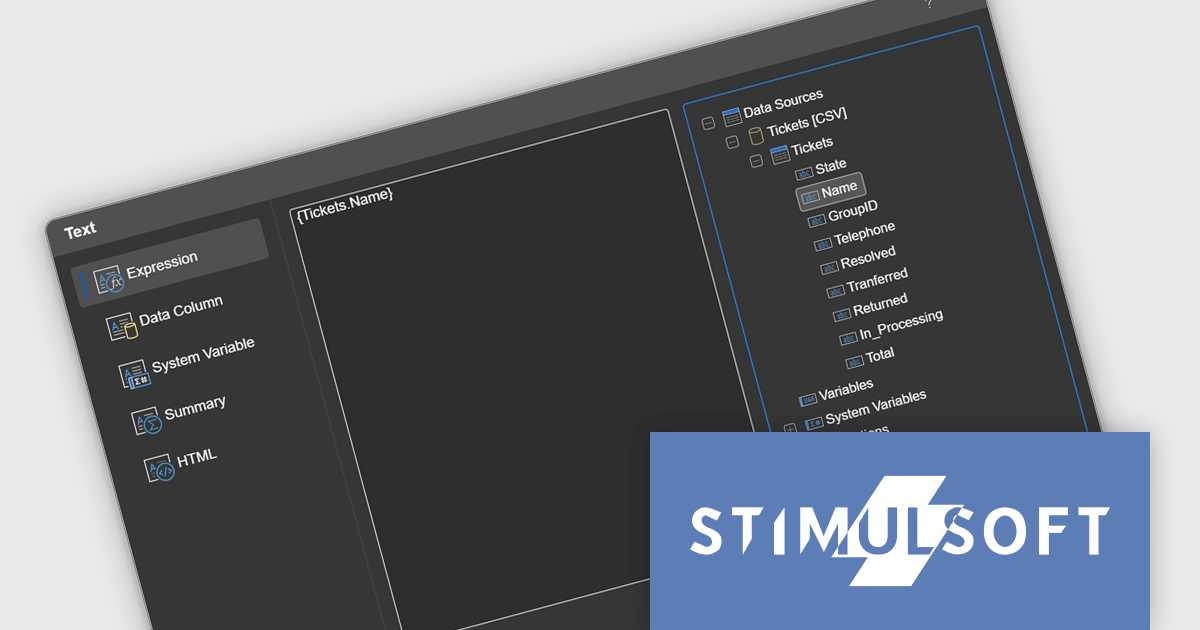
Stimulsoft Reports.JS provides a robust reporting toolkit designed specifically for JavaScript applications. This library leverages a client-side architecture, offering a pure JavaScript report engine for efficient report rendering directly within web browsers. The solution includes a user-friendly report designer for building reports with various data sources and visualizations, along with a report viewer for seamless integration and display within your JavaScript applications. This eliminates the need for server-side dependencies or browser plugins, simplifying the development process for embedding powerful reporting functionalities into your web projects.
The Stimulsoft Reports.JS 2025.1.1 update introduces integrated access to the data dictionary within component editors, enhancing the efficiency and precision of report design. This improvement enables developers to quickly reference and utilize data dictionary elements without switching contexts, simplifying the process of configuring and editing report components. By streamlining access to structured data, the update reduces the risk of errors, promotes consistency across reports, and accelerates the overall workflow, making it an essential enhancement for developers focused on creating complex and data-driven reports.
To see a full list of what's new in 2025.1.1, see our release notes.
Stimulsoft Reports.JS is licensed per developer and is available as a Perpetual license with 1 year support and maintenance. See our Stimulsoft Reports.JS licensing page for full details.
Stimulsoft Reports.JS is available individually or as part of Stimulsoft Ultimate.
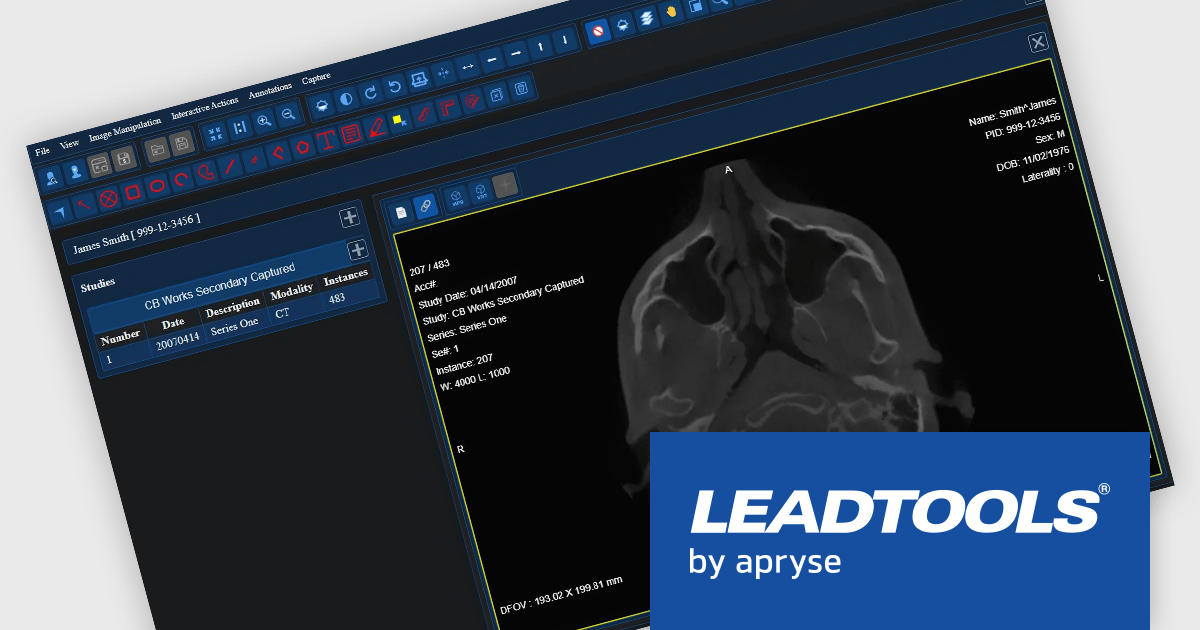
LEADTOOLS Medical SDK is designed to streamline the development of medical applications, offering support for DICOM datasets, 8-16 bit extended grayscale images, and advanced image annotation capabilities. It also includes specialized tools for displaying images, such as window leveling and LUT (Look-Up Table) processing, as well as medical-specific image processing. Additional features include lossless JPEG compression and the ability to process both signed and unsigned image data. The Medical Imaging Suite expands on this functionality with enhanced features, including HTML/JavaScript viewing for web-based medical image access.
The LEADTOOLS Medical SDK offers a React Medical Web Viewer that enables developers to build scalable, high-performance medical imaging applications with modular components. Its flexible architecture allows seamless integration with DICOMweb services, ensuring efficient data access and interoperability. Advanced client-side caching optimizes performance by reducing server load and accelerating image retrieval, while built-in 3D volume rendering enhances visualization for precise diagnostics. With customizable study layouts and robust annotation tools, developers can create tailored user experiences that meet diverse clinical needs while maintaining compliance with medical imaging standards.
LEADTOOLS Medical SDK is licensed as Development Licenses, for developers to use the SDKs, and Deployment Licenses, for the right to distribute end user solutions. See our LEADTOOLS Medical SDK licensing page for full details.
LEADTOOLS Medical SDK is available individually or as part of LEADTOOLS Medical Suite SDK.
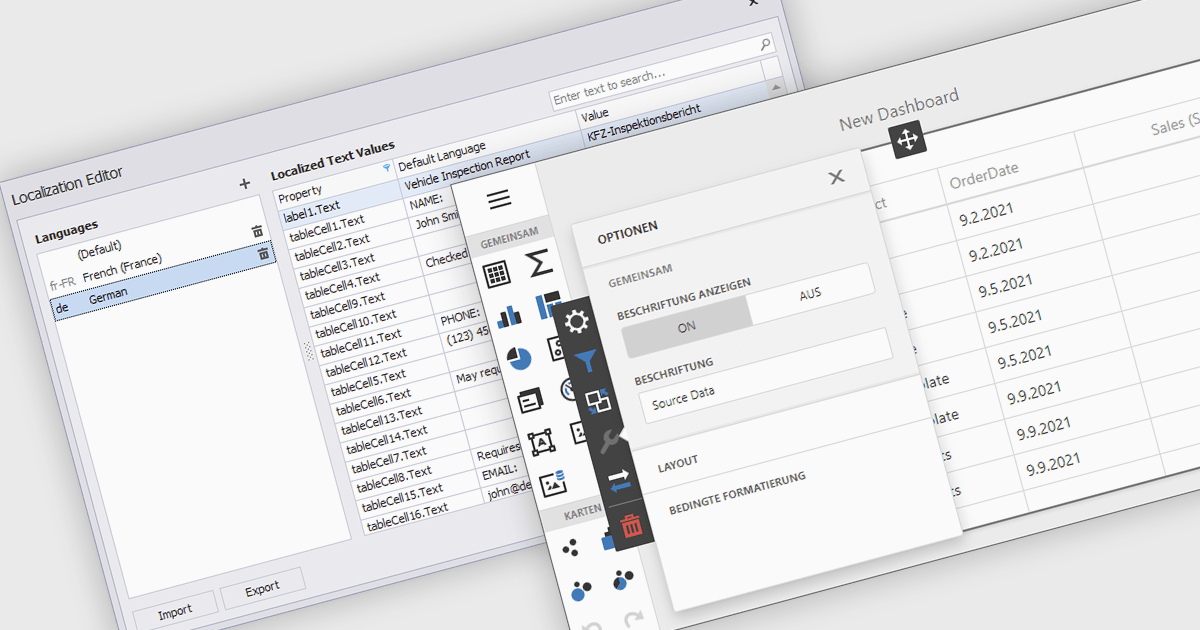
Localization is the process of adapting the user interface and data formatting to support multiple languages and regional conventions. This ensures users can interact with the editor in their preferred language while maintaining accuracy in date, number, and currency formats. It enhances usability, improves accessibility for global teams, ensures compliance with regional standards, and minimizes errors caused by inconsistent formatting. By enabling seamless multilingual collaboration, localization helps developers create inclusive, globally scalable applications that provide a consistent user experience across diverse markets.
Several React data editor collections offer localization support including:
For an in-depth analysis of features and price, visit our React data editors comparison:
联系电话: (888) 850 9911
传真: +1 770 250 6199


