













官方供应商
我们作为官方授权经销商,直接提供超过200家开发厂家所发行超过1000个的产品授权给您。
查看我们的所有品牌。
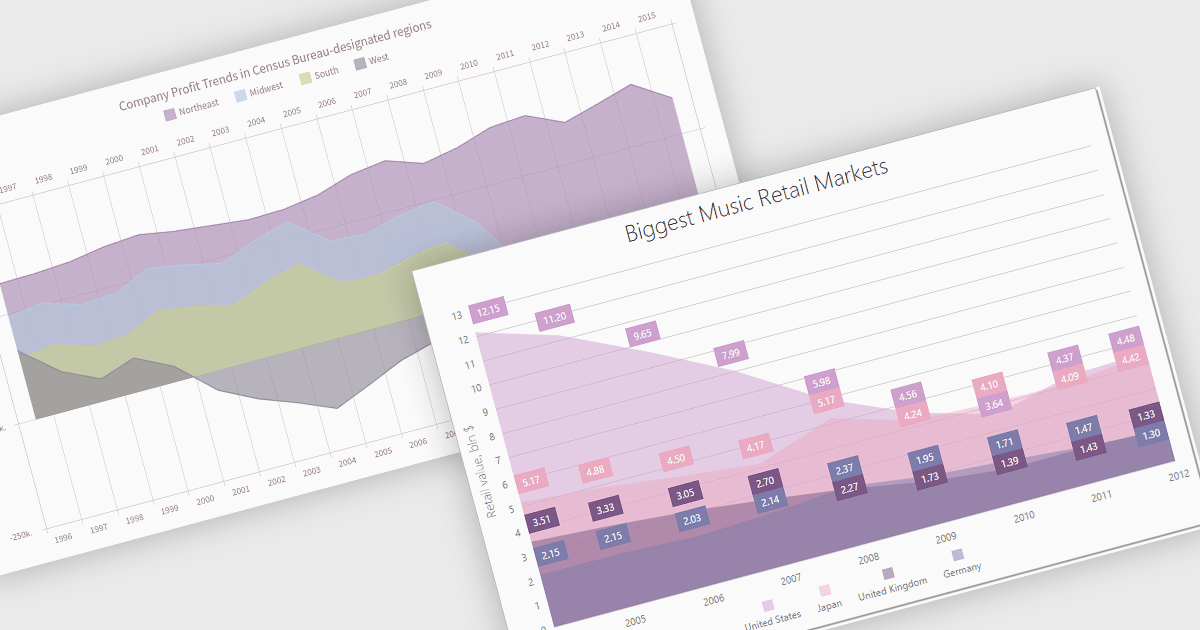
An area chart is a visualization tool that displays data as a filled area bounded by a line and the x-axis. It's particularly effective for illustrating trends and changes in data over time. By filling the area beneath the line, it visually represents the cumulative value of the data, making it easier to understand overall trends. This makes area charts ideal for visualizing metrics like sales over time, inventory levels, or stock prices.
Several Angular chart controls offer area charts including:
For an in-depth analysis of features and price, visit our Angular chart controls comparison.

GroupDocs.Viewer for Node.js via Java is a JavaScript library that allows you to display images and document formats in your web applications without needing to install additional software. It supports a wide range of file formats, including PDF, HTML, XML, Microsoft Word, Visio, Project, metafiles, and images. GroupDocs.Viewer for Node.js is also highly customizable, allowing you to display the whole document or render it partially to speed up the process. You can also view single pages, a specific cell range in a spreadsheet, or even render an individual document layer in formats such as, PDF and CAD.
The GroupDocs.Viewer for Node.js V24.8 release introduces a significant enhancement in image handling. By leveraging the embedded EXIF Orientation metadata within JPEG files, the library can now automatically rotate and flip images to their correct orientation. This ensures that regardless of how the image was originally captured or stored, it will always be displayed accurately to the viewer. This feature not only improves the user experience but also streamlines the development process by eliminating the need for manual image adjustments.
To see a full list of what's new in V24.8, see our release notes.
GroupDocs.Viewer for Node.js via Java is offered as Developer Small Business, Developer OEM, Site Small Business, and Site OEM licenses catering to a range of business needs. Licenses are perpetual, and include 1 year of support and maintenance. Subscription renewals are also available. See our GroupDocs.Viewer for Node.js via Java licensing page for full details.
GroupDocs.Viewer for Node.js via Java is available in the following products:
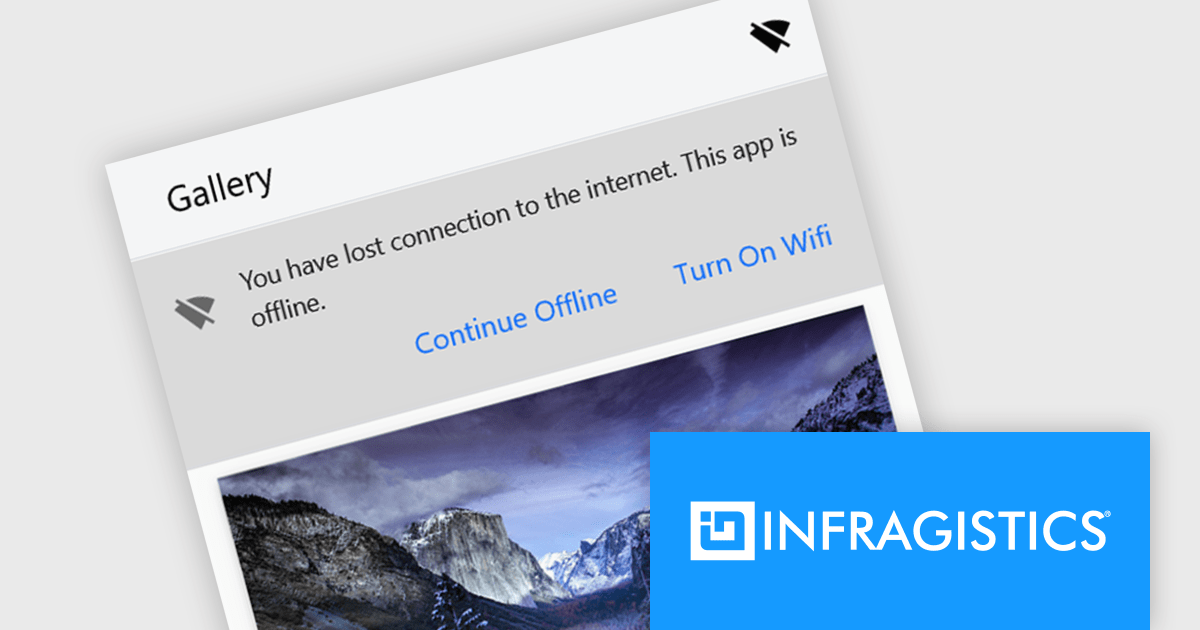
Infragistics Ignite UI for React is a comprehensive UI component library designed to accelerate the development of modern web applications. It offers a rich collection of high-performance, customizable components, including data grids, charts, scheduling, and more. The library's intuitive API and comprehensive documentation make it easy for developers to create visually appealing and interactive user interfaces. Key benefits include improved developer productivity, enhanced application performance, and access to a wide range of pre-built components.
The Ignite UI for React 18.7.0 release adds a new banner component that offers a versatile and effective way to communicate important information to your application's users. By strategically placing banners within your application's layout, you can ensure that crucial messages are prominently visible without obstructing the user's primary workflow. Banners can be customized to include specific actions or calls to action relevant to the message's context, empowering users to respond or take further steps. This flexibility makes banners an invaluable tool for delivering timely and engaging communications within your React-based applications.
To see a full list of what's new in version 18.7.0, see our release notes.
Infragistics Ignite UI for React is part of Infragistics Ignite UI which is licensed per developer and is available as a perpetual license with a 1, 2 or 3 year support and maintenance subscription. See our Infragistics Ignite UI licensing page for full details.
Infragistics Ignite UI for React is available to buy in the following products:
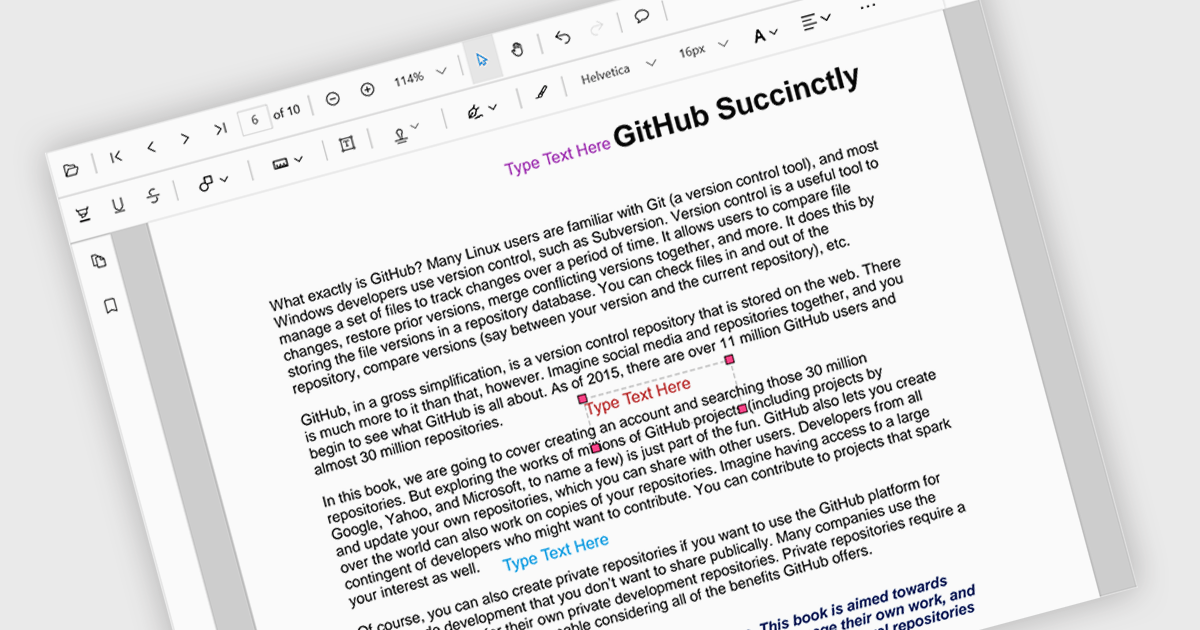
Free text annotations are textual comments or notes added to a document or image, independent of specific fields or structures. Unlike structured annotations that conform to predefined formats (e.g. highlighting, strikethrough), free text annotations provide flexibility for users to express their thoughts, questions, or observations in a more open-ended manner. This allows for richer and more personalized interactions with the content, making it valuable for tasks such as note-taking, research, and collaboration.
Several React PDF viewer controls offer support for free text annotations including:
For an in-depth analysis of features and price, visit our React PDF viewer controls comparison.
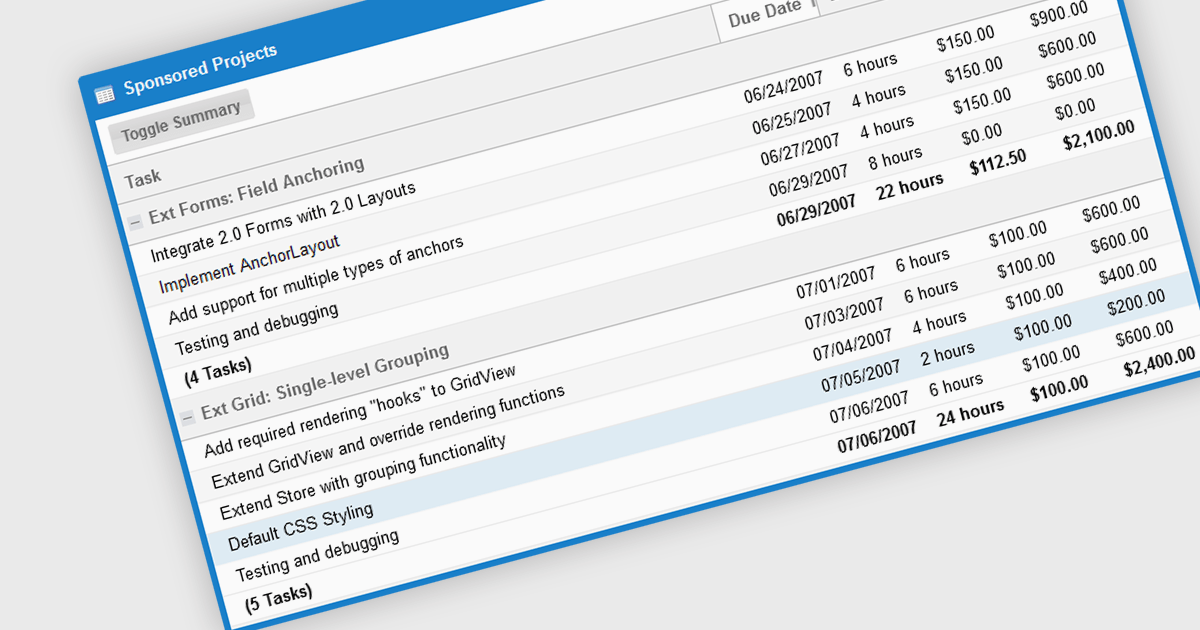
The grouping/summary feature in grid controls enables users to categorize and analyze data effectively by grouping rows based on specific criteria. This functionality allows for the aggregation of data within each group, providing valuable summaries such as totals, averages, counts, and more. By organizing information in a more structured manner, users can gain deeper insights into trends, patterns, and outliers within their data. This feature is particularly useful for large datasets, financial reporting, and data analysis tasks that require a high level of customization and flexibility.
Several JavaScript Grid controls offer grouping / summary support including:
For an in-depth analysis of features and price, visit our comparison of JavaScript grid controls.
联系电话: (888) 850 9911
传真: +1 770 250 6199


