


官方供应商
我们作为官方授权经销商,直接提供超过200家开发厂家所发行超过1000个的产品授权给您。
查看我们的所有品牌。
Infragistics Ignite UI for Web Components is a comprehensive library of pre-built, reusable UI components designed for constructing modern web applications using the Web Components standard. It offers a diverse collection of data grids, charts, and interactive elements, enabling developers to rapidly create high-performance, cross-platform applications without dependency complexities.
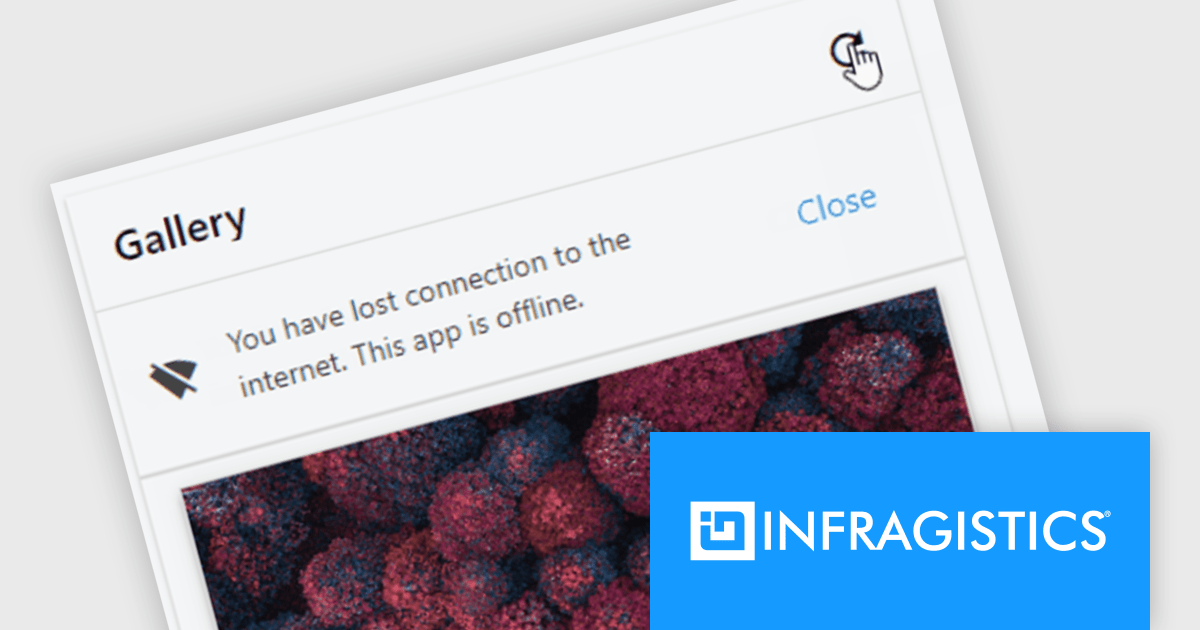
The Ignite UI for Web Components 24.1 update now includes a Banner component, offering developers a versatile tool for displaying prominent, persistent messages within applications. Positioned between the transient Snackbar and the modal Dialog, the Banner provides a non-intrusive way to convey crucial information to users. Its customizable features, including support for custom action buttons and icons, allow for tailored messaging and user interaction, enhancing application usability and user experience.
To see a full list of what's new in version 24.1 (4.10.0), see our release notes.
Infragistics Ignite UI for Web Componentsis part of Infragistics Ignite UI which is licensed per developer and is available as a Perpetual License with a 1, 2 or 3 year support and maintenance subscription. See our Infragistics Ignite UI licensing page for full details.
Ignite UI for Web Components is available to buy in the following products:
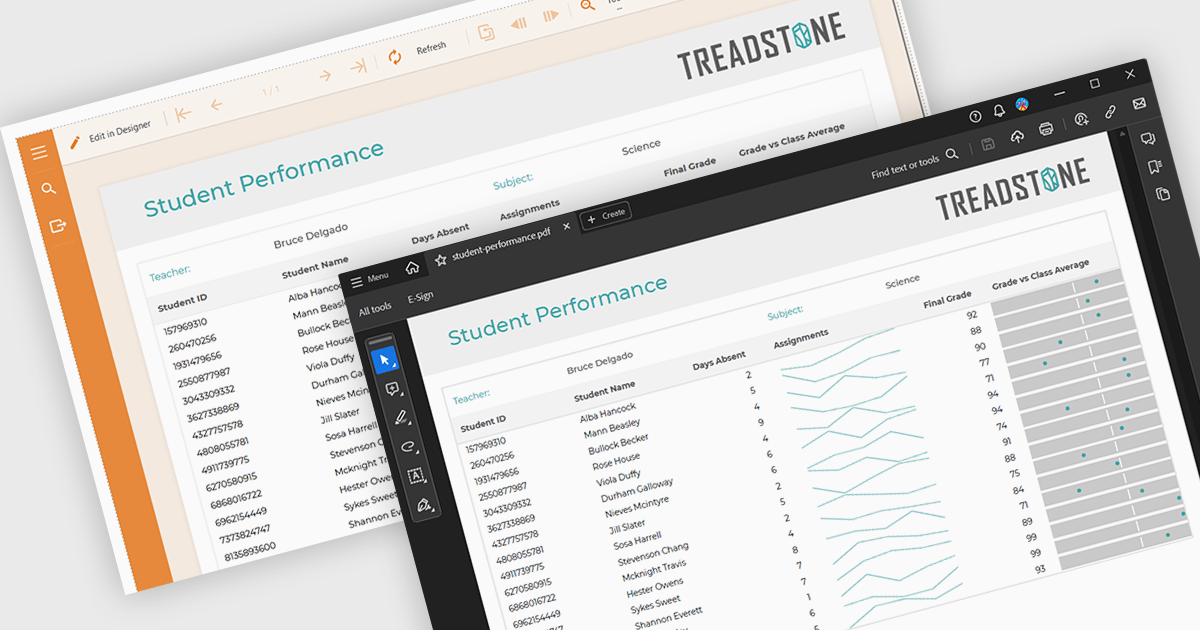
PDF export functionality within a reporting component enables the transformation of generated report data into a portable, high-fidelity PDF document. This capability offers significant advantages, including standardized document format compatibility, enhanced security through encryption options, optimized file size for efficient storage and transmission, and preservation of complex layout and formatting, ensuring consistent visual representation across different platforms and devices.
Several Angular reporting components offer PDF export support including:
For an in-depth analysis of features and price, visit Angular reporting components comparison.
Infragistics Ignite UI for React is a comprehensive suite of enterprise-grade React UI components designed to accelerate the development of modern, high-performance web applications. Packed with features such as data grids, charts, gauges, and spreadsheets, it empowers developers to visualize and interact with complex data effortlessly. Ignite UI for React offers exceptional performance, customization options, and responsive design, facilitating the creation of engaging user experiences across various devices.
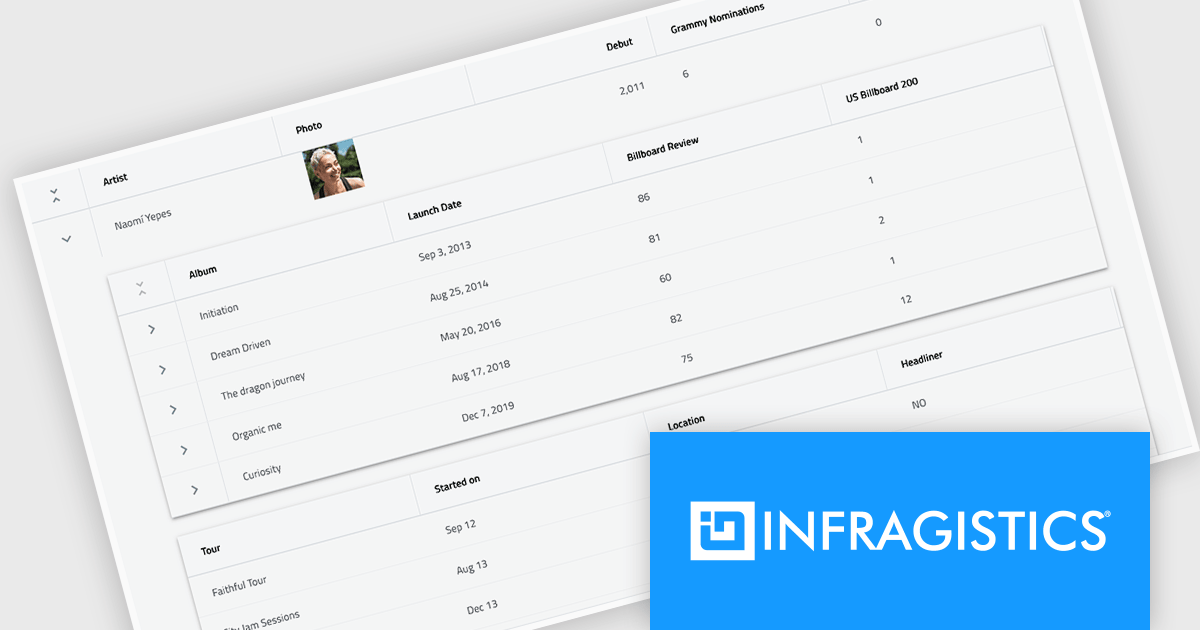
Infragistics Ignite UI Version 24.1 (Infragistics Ignite UI for React 18.6.0) adds a new Hierarchical Data Grid component, which provides a robust solution for visualizing and interacting with complex, hierarchical datasets. It empowers users to effortlessly expand or collapse parent rows to reveal detailed child grids, offering an intuitive, dynamic way to explore data at various levels of granularity. With rapid data binding, extensive customization options, and a comprehensive suite of functionality the Hierarchical Data Grid is a versatile tool for creating engaging and informative data-driven applications.
To see a full list of what's new in version 24.1 (18.6.0), see our release notes.
Infragistics Ignite UI for React is part of Infragistics Ignite UI which is licensed per developer and is available as a Perpetual License with a 1, 2 or 3 year support and maintenance subscription. See our Infragistics Ignite UI licensing page for full details.
Infragistics Ignite UI for React is available to buy in the following products:
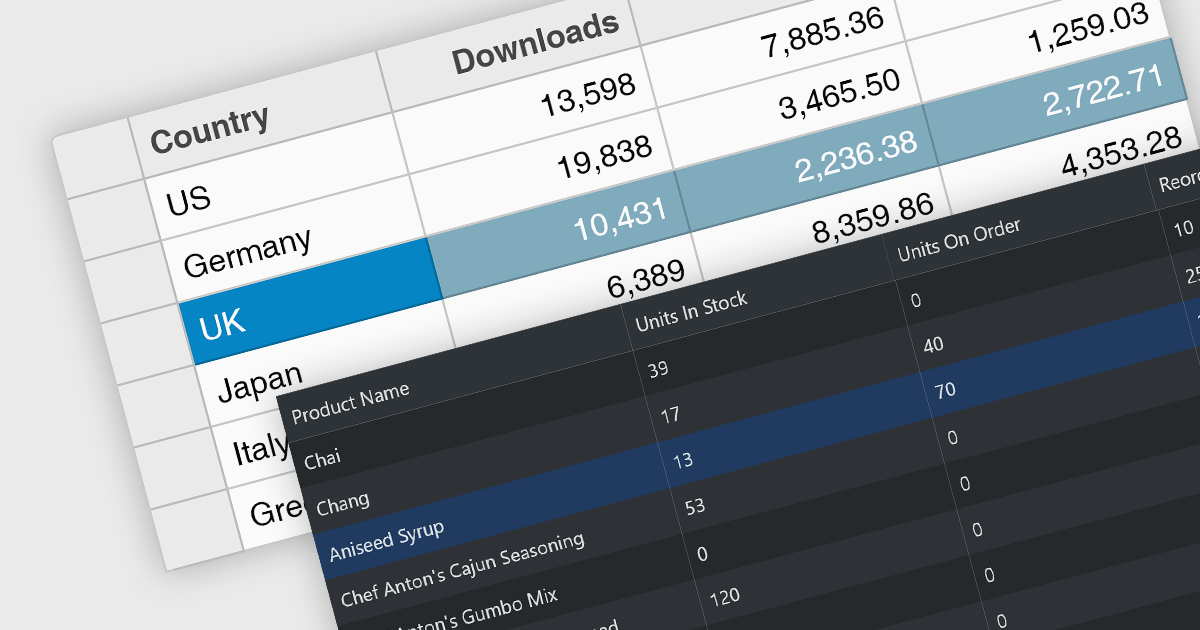
Row selection functionality empowers users to interact with data grids by selecting individual or multiple rows, enabling efficient data manipulation and analysis. Users can perform actions on selected rows such as editing, deleting, exporting, or filtering data. This feature significantly enhances user experience and productivity by providing a direct and intuitive way to manage and process large datasets, facilitating tasks like batch updates, generating reports, or performing complex data operations based on user-defined criteria.
Several React grid controls offer row selection including:
For an in-depth analysis of features and price, visit our comparison of React grid controls.
Infragistics Ignite UI for Angular is a comprehensive suite of Angular components and UI controls designed to accelerate development of high-performance, enterprise-grade web applications. It offers a rich collection of data grids, charts, and other UI elements, along with advanced features like pivoting, docking, and hierarchical data management. Built on Angular, the toolkit integrates seamlessly into existing projects and provides a foundation for building modern, responsive, and interactive user interfaces.
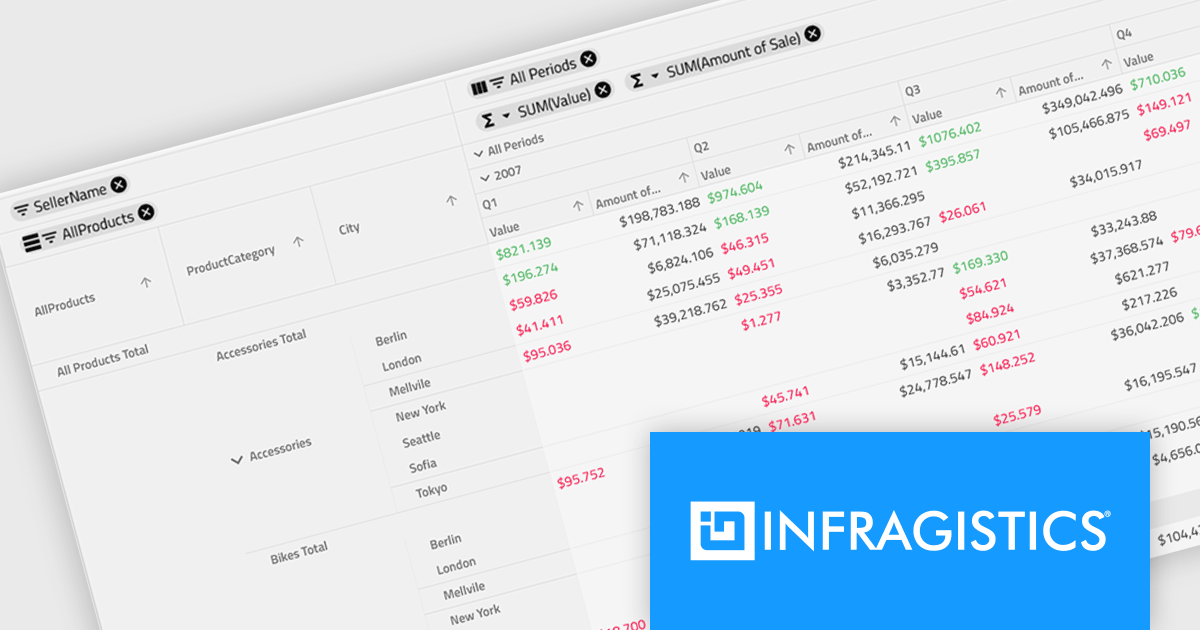
Ignite UI for Angular's Pivot Grid now offers horizontal row dimension expansion, providing developers with greater flexibility in data visualization. In this mode, child elements of a row dimension are displayed horizontally within the same multi-row layout instead of vertically. This approach allows for a more compact and potentially informative representation of hierarchical data, enabling users to easily compare related data points within a single row context. Developers can dynamically toggle between horizontal and vertical expansion modes to suit their specific data analysis requirements.
To see a full list of what's new in version 24.1 (18.1.0), see our release notes.
Infragistics Ignite UI for Angular is part of Infragistics Ignite UI which is licensed per developer and is available as a Perpetual License with a 1, 2 or 3 year support and maintenance subscription. See our Infragistics Ignite UI licensing page for full details.
Infragistics Ignite UI for Angular is available in the following products:
联系电话: (888) 850 9911
传真: +1 770 250 6199


