













官方供应商
我们作为官方授权经销商,直接提供超过200家开发厂家所发行超过1000个的产品授权给您。
查看我们的所有品牌。
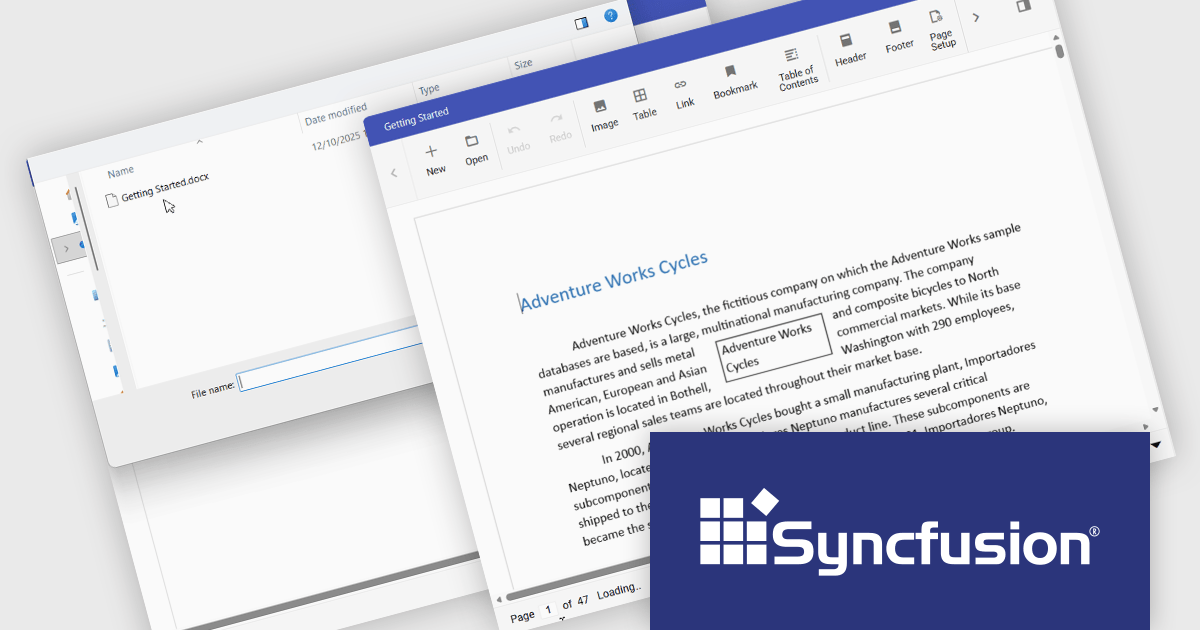
The Syncfusion DOCX Editor SDK provides a Microsoft Word inspired WYSIWYG editor that lets developers add Word document drafting, editing, and report generation to web and .NET desktop applications. It supports rich formatting with styles, tables, images, lists, and track changes, helping users create consistent, professional documents. With import and export support and a familiar interface, it reduces development effort and improves productivity for use cases like reporting, proposals, contracts, and document processes in business applications.
The Syncfusion Essential Studio DOCX Editor SDK 2025 Volume 4 update introduces asynchronous document loading for the Blazor DOCX Editor. This improves application responsiveness by preventing the user interface from blocking while documents are fetched and opened. By allowing document loading to occur in the background, developers can ensure the main thread remains available for user interactions, resulting in smoother navigation and more predictable behavior during network or file access delays. This enhancement helps create more responsive, user friendly applications, particularly when working with large documents or remote data sources.
To see a full list of what's new in Syncfusion Essential Studio DOCX Editor SDK 2025 Volume 4 (32.1.19), see our release notes.
Syncfusion Essential Studio DOCX Editor SDK is licensed per developer as a timed one year subscription that must be renewed to continue using the software. It is runtime royalty free for redistribution with a current subscription and includes one year of unlimited updates and 24/5 support with one business day responses. See our Syncfusion Essential Studio DOCX Editor SDK licensing page for full details.
Learn more on our Syncfusion Essential Studio DOCX Editor SDK product page.

ComponentOne Studio Enterprise is a comprehensive suite of .NET UI controls developed by MESCIUS (formerly GrapeCity) designed for building rich, interactive desktop, web, and mobile applications. It provides developers with a broad range of tools and components-including data grids, charts, reports, input controls, and advanced data visualization features-for platforms such as WinForms, WPF, ASP.NET Core, Blazor, WinUI, and .NET MAUI. The suite emphasizes performance, flexibility, and ease of integration, helping teams create consistent, feature-rich user experiences across multiple application types while maintaining a unified development approach.
The ComponentOne Studio Enterprise 2025 v2 update introduces 2D Contour Charts in FlexChart for WPF, allowing developers to represent three-dimensional data on a two-dimensional surface through contour lines or shaded bands that highlight areas of equal value. This capability delivers a clear visual understanding of gradients, surface characteristics, and other continuous data patterns. With support for multiple contour types, customizable contour levels, and flexible gradient color palettes, developers gain precise control over how value transitions are presented. These enhancements make the WPF contour chart well suited for scientific and engineering analysis, elevation and surface mapping, and any application that requires accurate comparison of value distribution across two variables.
To see a full list of what's new in 2025 v2, see our release notes.
ComponentOne Studio Enterprise is licensed per developer on a perpetual basis and includes a 12 month subscription. Priority Support is also available. See our ComponentOne Studio Enterprise licensing page for full details.
Learn more on our ComponentOne Studio Enterprise product page.
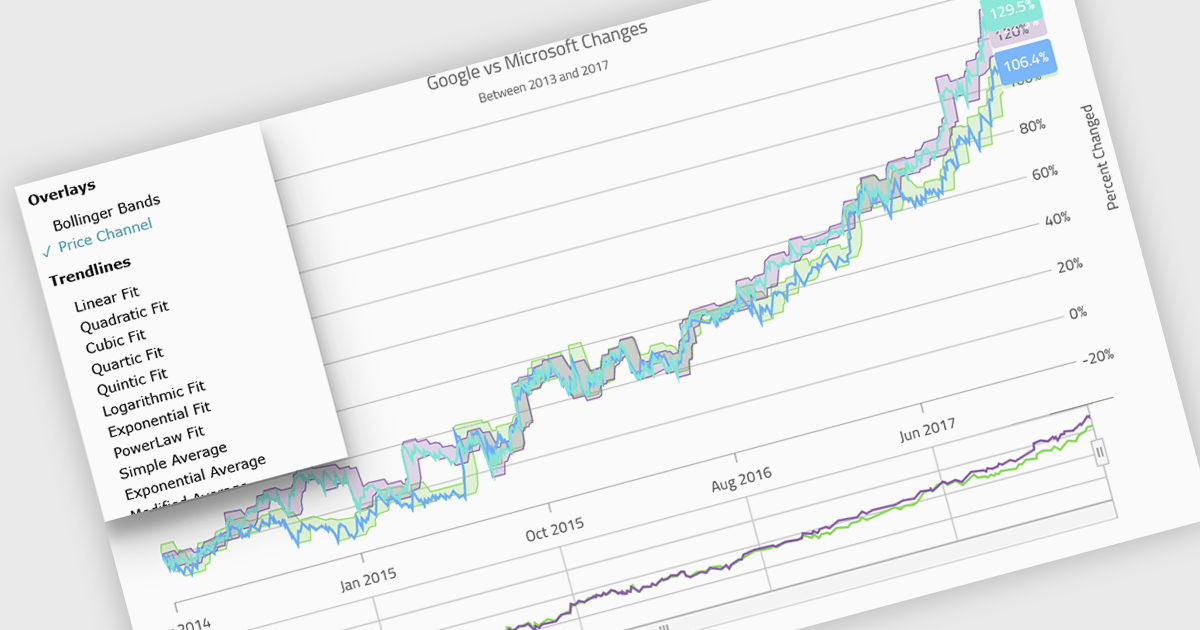
Indicators in a chart component are visual tools used to represent specific statistical or mathematical calculations directly on the chart, often to highlight trends, patterns, or key thresholds within the underlying data. Common in financial and analytical applications, indicators can include elements like moving averages, Bollinger Bands, or threshold lines. For software developers, implementing indicators provides a powerful way to enhance data interpretation by allowing users to see meaningful context and actionable insights without needing to leave the chart interface. This improves decision-making and supports more interactive and informative visualizations across a wide range of use cases.
Several .NET Blazor charting controls support indicators including:
For an in-depth analysis of features and price, visit our comparison of .NET Blazor Chart Controls.
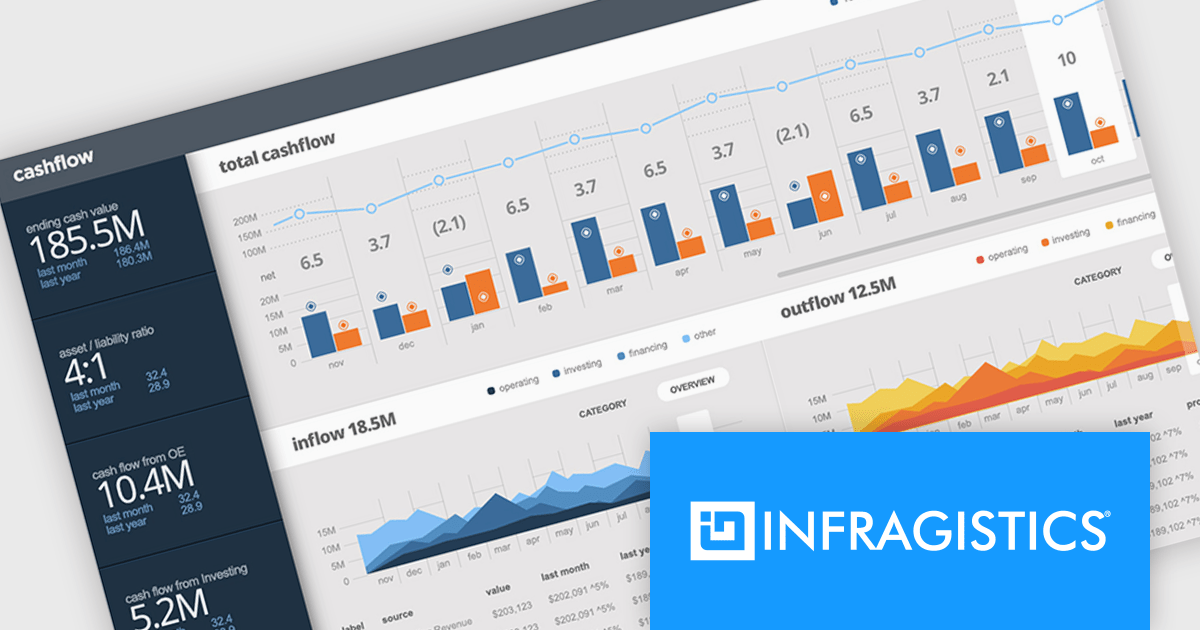
Infragistics Ultimate is a comprehensive toolkit designed to improve UX/UI creation and development across desktop, web, and mobile platforms. It offers hundreds of pre-built, high-performance UI components like grids and charts, alongside design-to-code tools for rapid prototyping, user testing, and even code generation. This enables developers and designers to create visually appealing and interactive applications faster, while its support for various frameworks and platforms ensures flexibility.
Infragistics Ultimate UI for Windows Forms, Ultimate UI for WPF, and Ignite UI for Blazor now support .NET 10. With runtime improvements, such as better just-in-time inlining, enhanced struct argument handling, NativeAOT enhancements, and updates to collections, serialization, and diagnostics APIs, Infragistics' .NET 10 support ensures you can fully leverage these performance, security, and API benefits while using its mature UI libraries.
Infragistics Ultimate UI for Windows Forms, Ultimate UI for WPF and Ignite UI for Blazor are licensed per developer and are available as a Perpetual License with 1, 2 or 3 year support and maintenance subscription. See our Infragistics Ultimate UI for Windows Forms, Ultimate UI for WPF and Ignite UI licensing pages for full details.
For more information please visit our product pages:
Infragistics Windows Forms, WPF and Ignite UI are also available in the following product suites:
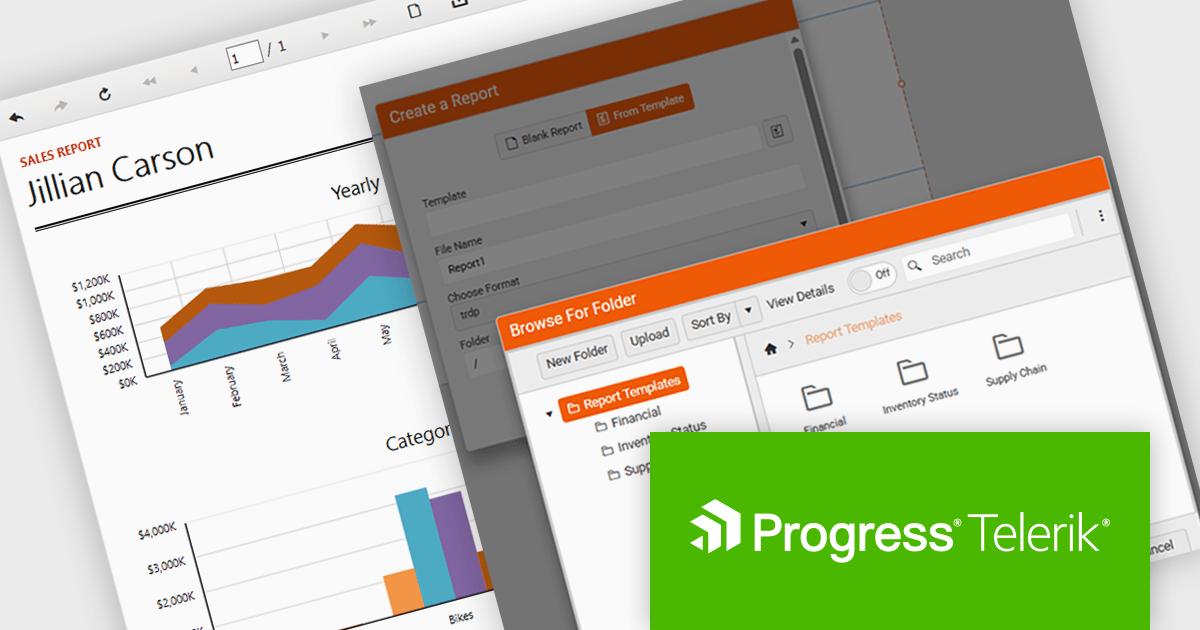
Telerik Reporting is a comprehensive and lightweight embedded reporting tool for .NET web and desktop applications. It enables developers and reporting users to create, design, and export visually appealing, interactive, and reusable reports to effectively present analytical and business data. It supports various technologies, including ASP.NET Core, Blazor, ASP.NET MVC, ASP.NET AJAX, HTML5/JS, Angular, WPF, WinForms, and WinUI.
The Telerik Reporting 2025 Q4 update introduces customizable report templates in the Web Report Designer, giving developers a faster and more controlled way to produce consistent, production-ready reports. By allowing teams to define, save and reuse templates that include predefined layout structures, styling rules and data components, the feature reduces repetitive setup work, maintains uniform design standards across projects and ensures every new report begins with a reliable, compliant foundation.
To see a full list of what's new in 2025 Q4 (19.3.25.1111), see our release notes.
Telerik Reporting is licensed per developer and is available as a perpetual license with a one year support subscription, which is offered in three tiers: Lite, Priority or Ultimate. See our Telerik Reporting licensing page for full details.
Telerik Reporting is available to buy in the following products:
联系电话: (888) 850 9911
传真: +1 770 250 6199


