


官方供应商
我们作为官方授权经销商,直接提供超过200家开发厂家所发行超过1000个的产品授权给您。
查看我们的所有品牌。
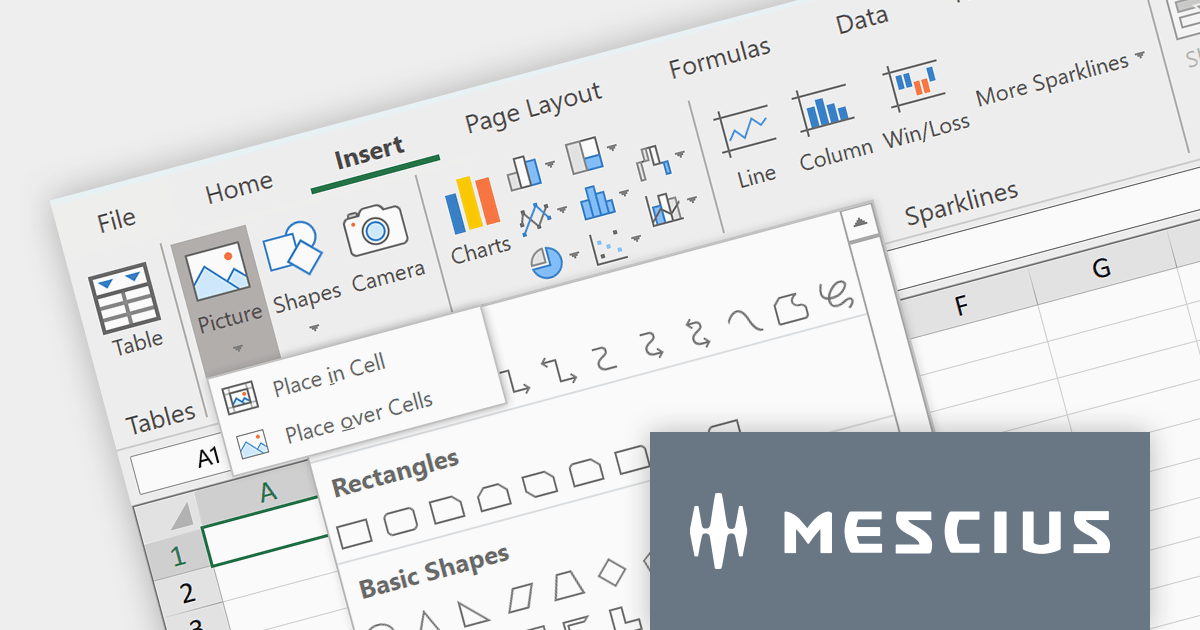
Spread.NET by MESCIUS is a powerful tool for building Excel-like applications in your .NET projects. It lets you create interactive spreadsheets, grids, dashboards, and even forms within WinForms, ASP.NET, and WPF applications. With its rich feature set, including a robust calculation engine, formula support, and Excel compatibility, Spread.NET empowers developers to build data analysis tools, budgeting apps, scientific dashboards, and more, all within the familiar .NET environment.
The Spread.NET v17 release adds a new Ribbon control to modernize your spreadsheet's look and feel. Inspired by Excel, this intuitive interface organizes commands into clear, contextual tabs and groups, making it easy for users to find the tools they need. This modern upgrade not only boosts productivity but also brings a familiar feel to your spreadsheets, streamlining the entire user experience.
To see a full list of what's new in version 17, see our release notes.
Spread.NET is licensed per developer and is available as a Perpetual License with a 12 month support and maintenance subscription. We can supply any Spread.NET license including new licenses, maintenance renewals, and upgrade licenses. See our Spread.NET licensing page for full details.
For more information, visit our Spread.NET product page.
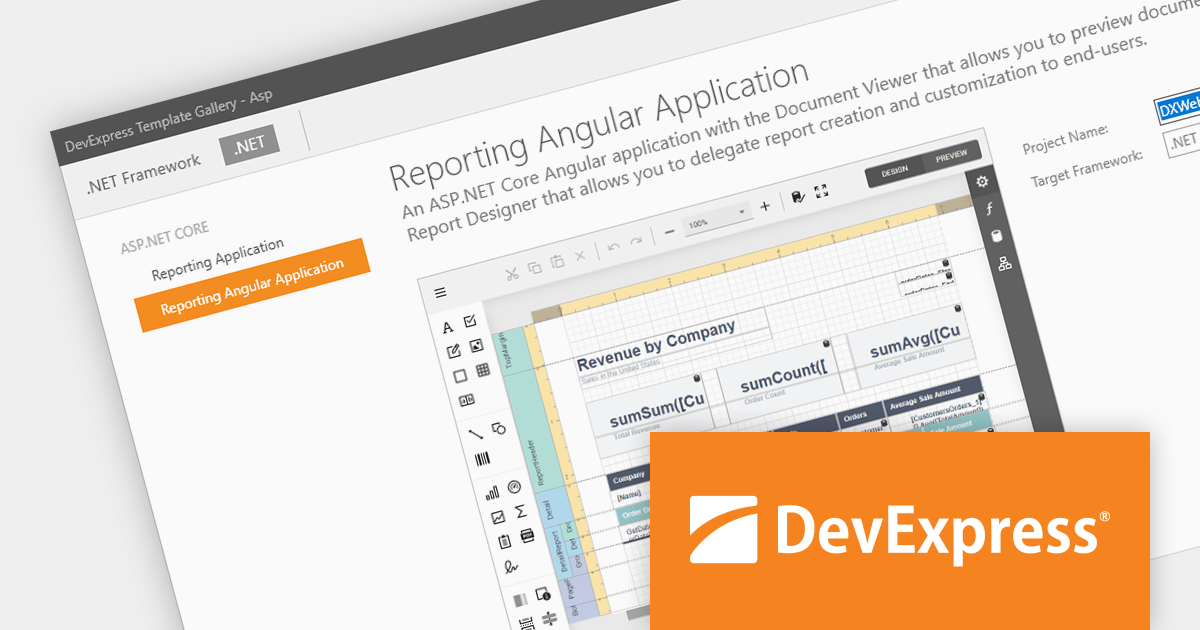
DevExpress Reporting is a powerful, versatile tool for building reports in the .NET ecosystem. It lets you design professional-looking reports with a visual editor, connect to various data sources, and customize them with charts, graphs, and interactive elements. Whether you're creating invoices, sales summaries, or complex dashboards, DevExpress Reporting offers the flexibility and features to bring your data to life in a clear and insightful way. It integrates seamlessly with WinForms, WPF, Web, and Blazor applications, making it a popular choice for developers who need a robust reporting solution.
The DevExpress Reporting 23.2 release introduces a native Angular Report Viewer. This new component seamlessly integrates into your Angular applications, eliminating the need for Knockout.js. Built for performance, it leverages native platform rendering for lightning-fast document visualization. Property management is simplified, replacing observable complexities with a straightforward event-based mechanism. To optimize development, you can now utilize native Angular components as templates for report viewer elements. Embrace a streamlined, efficient, and Knockout-free reporting experience with the Native Angular Report Viewer.
To see a full list of what's new in version 23.2, see our release notes.
DevExpress Reporting is licensed per developer and is available as a Perpetual License with a 12 month support and maintenance subscription. See our DevExpress Reporting licensing page for full details.
DevExpress Reporting is available to buy in the following products:
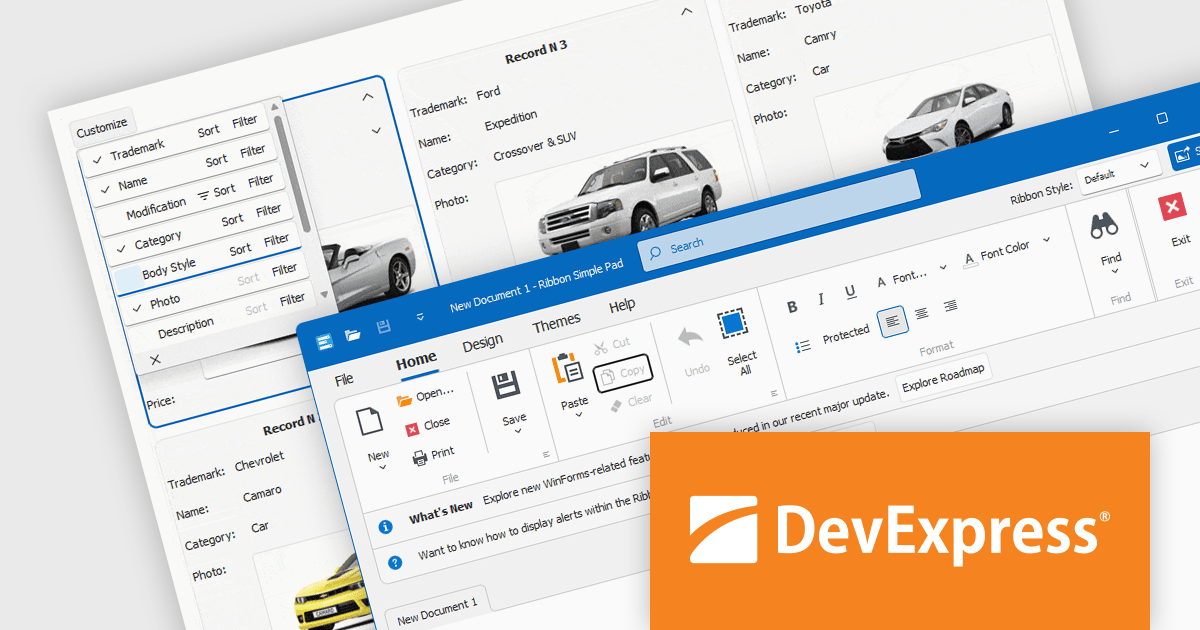
DevExpress WinForms is a comprehensive suite of 190+ UI controls and development tools designed for building high-performance desktop applications. It offers a broad array of customizable controls, from data grids and ribbon interfaces to advanced charts, maps, and diagramming components. This empowers developers to rapidly create functionally rich applications, while adhering to accessibility guidelines and touch-enabled technology for modern Windows environments.
The DevExpress WinForms 23.2 release adds accessible keyboard navigation support to several controls, including the Ribbon, Backstage View, Recent Control, Data Grid, TreeList, CardView, Breadcrumb Editor, and Expression Editor. Users can navigate using arrow keys, keyboard shortcuts, and the Enter and Escape keys.
To see a full list of what's new in version 23.2, see our release notes.
DevExpress WinForms is licensed per developer and is available as a Perpetual License with a 12 month support and maintenance subscription. See our DevExpress WinForms licensing page for full details.
DevExpress WinForms is available to buy in the following products:
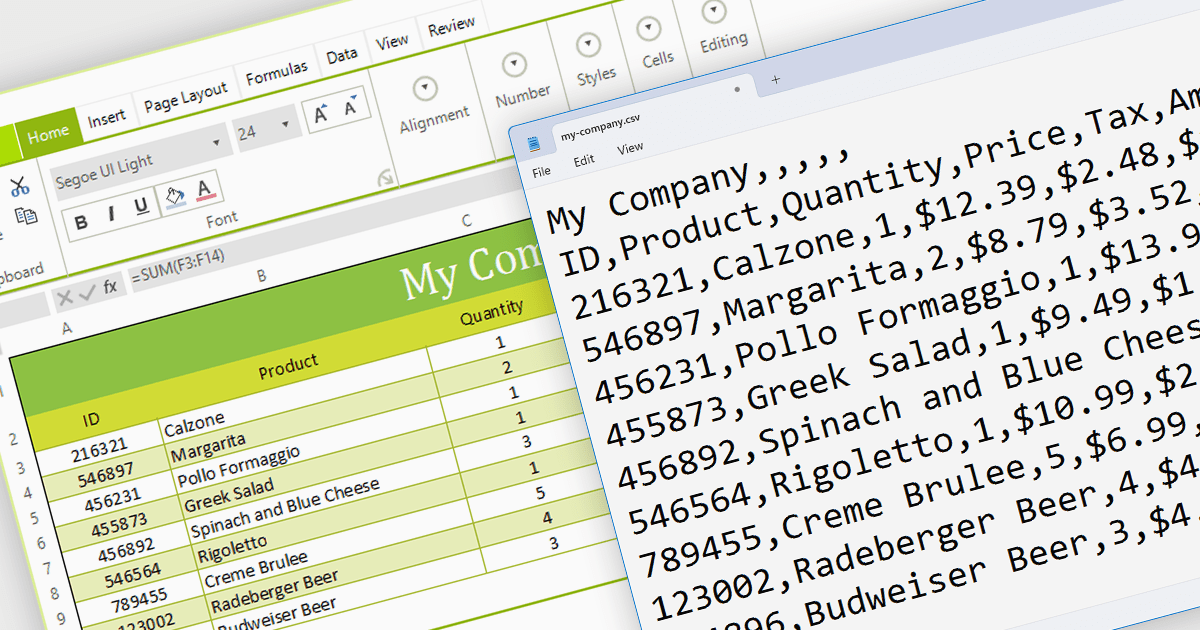
The ability to export to comma-separated values (CSV) from a spreadsheet control enhances interoperability and data accessibility. It seamlessly translates spreadsheet data into the ubiquitous CSV format, fostering effortless integration with a vast ecosystem of analytical tools, databases, and third-party applications. This democratizes your data, empowering users to leverage existing workflows and external expertise, enriching analysis, and maximizing the reach and impact of your data-driven insights.
Several WinForms spreadsheet components provide CSV export functionality, including:
For an in-depth analysis of features and price, visit our WinForms Spreadsheet Component comparison.

Converting PDFs to images is a feature that allows users to transform each page of a PDF into a separate image file, such as JPEG or PNG. This is useful for previewing documents in environments where PDFs are not natively supported, or for including PDF content in graphic design projects.
Several WinForms PDF Components support PDF to Image conversion including:
For an in-depth analysis of features and price, visit our WinForms PDF Components comparison.
联系电话: (888) 850 9911
传真: +1 770 250 6199


