


官方供应商
我们作为官方授权经销商,直接提供超过200家开发厂家所发行超过1000个的产品授权给您。
查看我们的所有品牌。
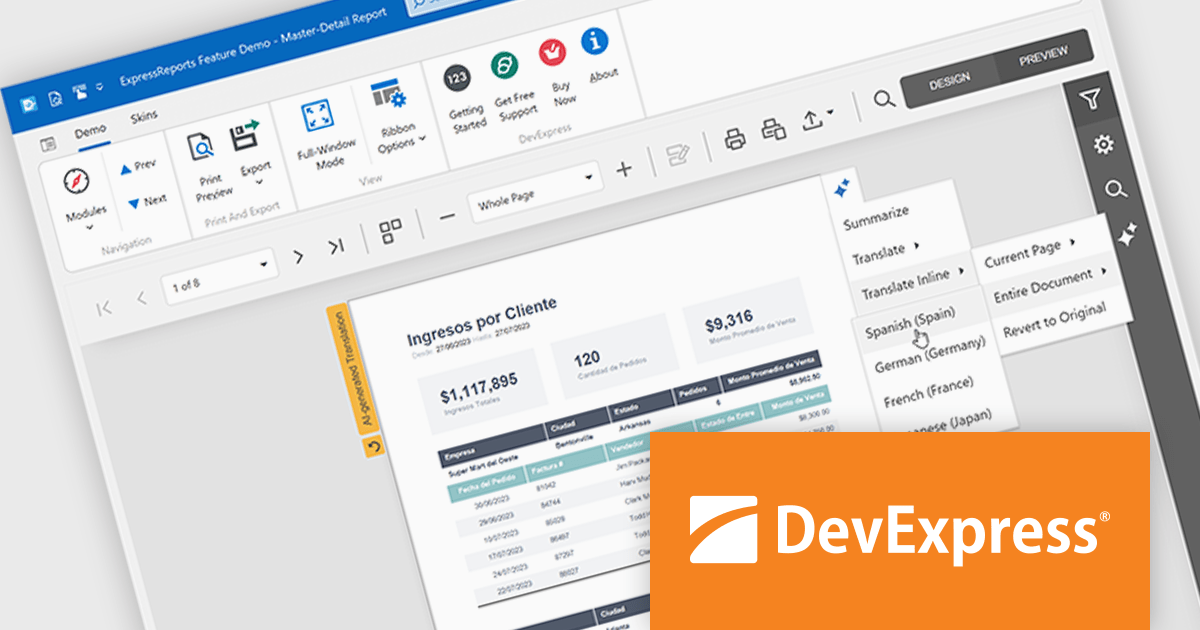
DevExpress (Developer Express) is an award-winning software development company based in the United States. It produces coding assistance tools and components for Delphi, C++ Builder and Microsoft Visual Studio developers. The major part of its product line is VCL, .NET WinForms and ASP.NET components that replicate the UI of Microsoft Windows and Microsoft Office applications.
With the recent release of version 25.1, the entire DevExpress product line has undergone significant changes:
This powerful new functionality comes at a higher price. DevExpress has implemented price raises across all product lines for both new licenses and renewals. To view all of the current, updated prices, see the comprehensive product list on the DevExpress Brand Page.
**Note: If you have a current, valid quote from ComponentSource at the previous pricing, the price will be honored up to that quote's expiration date.
The DevExpress VCL Subscription + (DevExpress VCL Subscription Plus) includes:
DevExpress Reporting is available to buy in the following products:
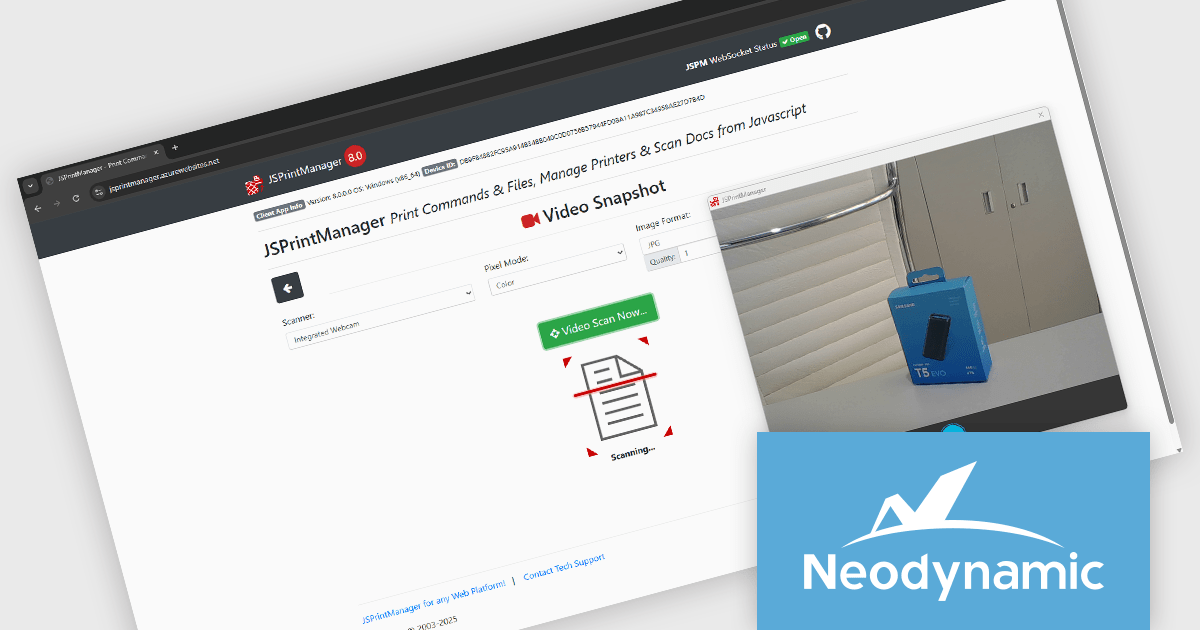
Neodynamic offers two JSPrintManager solutions for client-side printing and scanning in web applications. JSPrintManager for Any Web Platform allows you to integrate printing functionality into any website built with technologies like ASP.NET, PHP, or Blazor using pure JavaScript. Neodynamic also offers JSPrintManager for Blazor which enables you to seamlessly add printing capabilities to your Blazor server or WebAssembly projects with C# code. Both solutions empower you to print various data formats directly from the browser without requiring user interaction with print dialogs.
The Neodynamic JSPrintManager 8.0 releases add the ability for the Windows Client to take a video snapshot through any video device available on the client PC. This means, for example, that a camera can be used as a scanner to take a snapshot/picture. This is particularly useful in contexts where quick documentation is needed, such as capturing IDs, receipts, or physical documents, without needing a separate scanning application. It reduces reliance on traditional scanners and broadens the type of input devices that can integrate with browser-based printing operations.
To see a full list of what's new in 8.0, see our release notes for JSPrintManager for Any Web Platform and JSPrintManager for Blazor.
Neodynamic JSPrintManager is licensed per Web App and Web server and is available as a Perpetual license which includes 1 year of free updates and priority support. See our Neodynamic JSPrintManager for Any Web Platform and Neodynamic JSPrintManager for Blazor licensing pages for full details.
Learn more on our Neodynamic JSPrintManager for Any Web Platform and Neodynamic JSPrintManager for Blazor product pages.
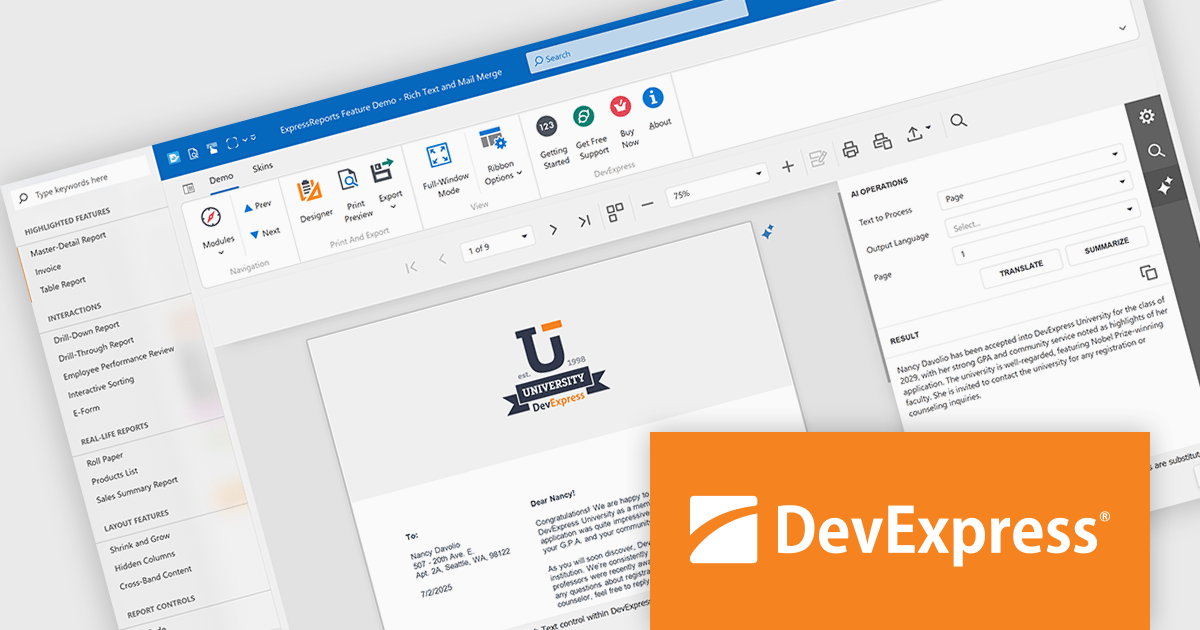
DevExpress VCL Subscription + (DevExpress VCL Subscription Plus) is an enhanced offering for Delphi and C++Builder developers, combining its traditional VCL components with a comprehensive suite of web UI libraries. The subscription includes access to DevExpress's JavaScript, ASP.NET Core, and Blazor UI components, enabling developers to build both native Windows applications and modern web applications under a single license.
The VCL Subscription provides a robust set of native Windows UI components designed for high-performance desktop development. It includes popular controls such as the Grid, TreeList, Rich Edit, Scheduler, and Pivot Grid, which are optimized for responsiveness and a consistent Windows look and feel. These components support advanced features like data grouping, filtering, charting, and document editing, giving developers the tools to create sophisticated, business-grade applications. Designed specifically for VCL (Visual Component Library), this suite ensures deep integration with the Windows API and RAD Studio environment, offering speed, stability, and ease of customization.
The "+" in VCL Subscription + expands this toolkit with access to DevExpress JavaScript, ASP.NET Core, and Blazor UI libraries. These include support for modern web frameworks like Angular, React, and Vue through the JavaScript UI suite, which features controls such as DataGrid, Scheduler, Charts, and Dashboard. The ASP.NET Core and Blazor components bring server-side and client-side capabilities, allowing developers to use C# and Razor for web development while leveraging rich UI elements. For those accustomed to building with VCL, these additions offer a path to web development without sacrificing familiar design patterns or DevExpress quality. It opens the door to hybrid applications and future-proof solutions that span both desktop and web environments.
DevExpress VCL Subscription + is licensed per developer and is available as a Perpetual License with a 12 month support and maintenance subscription. See our DevExpress VCL Subscription + licensing page for full details.
For more information, visit our DevExpress VCL Subscription + product page.
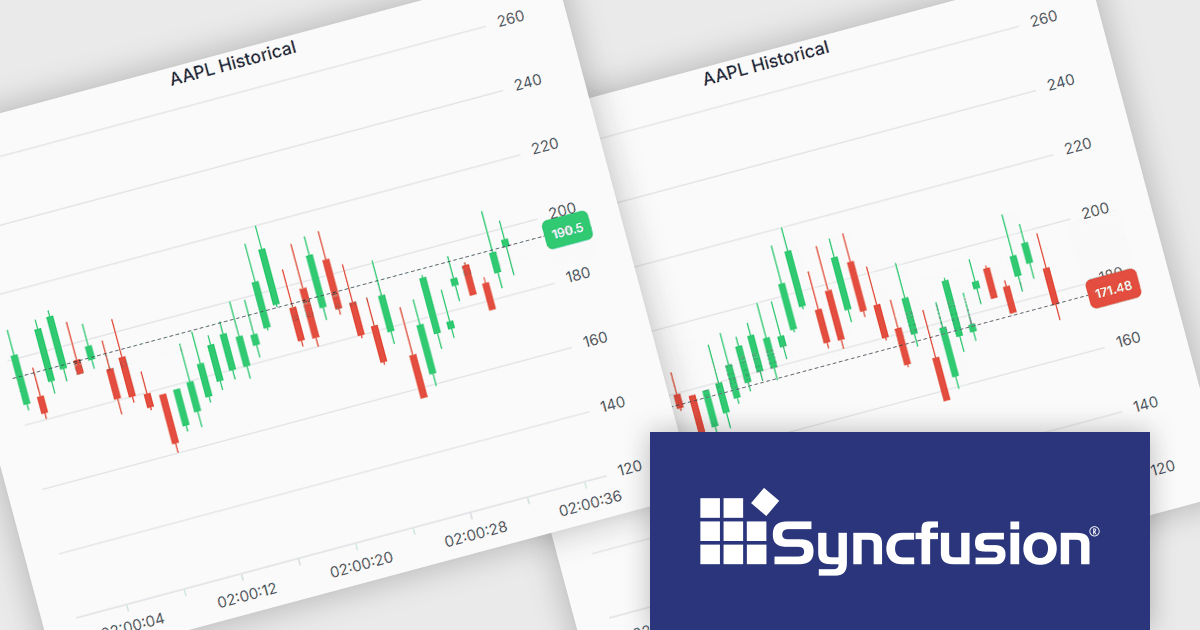
Syncfusion Essential Studio JavaScript is a comprehensive UI library offering over 80 high-performance, lightweight, and responsive components to transform your web apps. Built from scratch with TypeScript, it boasts modularity and touch-friendliness, letting you pick and choose specific features while ensuring smooth mobile interaction. With rich themes, global accessibility features, and extensive documentation, it powers everything from basic buttons to interactive charts and data grids, simplifying frontend development across JavaScript, Angular, React, and Vue.
The Syncfusion Essential Studio JavaScript 2025 Volume 2 update introduces support for highlighting the last value of a series in the Chart component with a label and a grid line indicator. This makes it easier for users to identify the most recent data point at a glance, improving chart readability without requiring interaction. It’s especially useful in scenarios like financial dashboards or performance tracking where the latest value is the key focus.
To see a full list of what's new in 2025 Volume 2 (30.1.37), see our release notes.
Syncfusion Essential Studio JavaScript is available as part of Syncfusion Essential Studio Enterprise which is licensed per developer starting with a Team License of up to five developers. It is available as a 12 Month Timed Subscription License which includes support and maintenance. See our Syncfusion Essential Studio Enterprise licensing page for full details.
Learn more on our Syncfusion Essential Studio JavaScript product page.
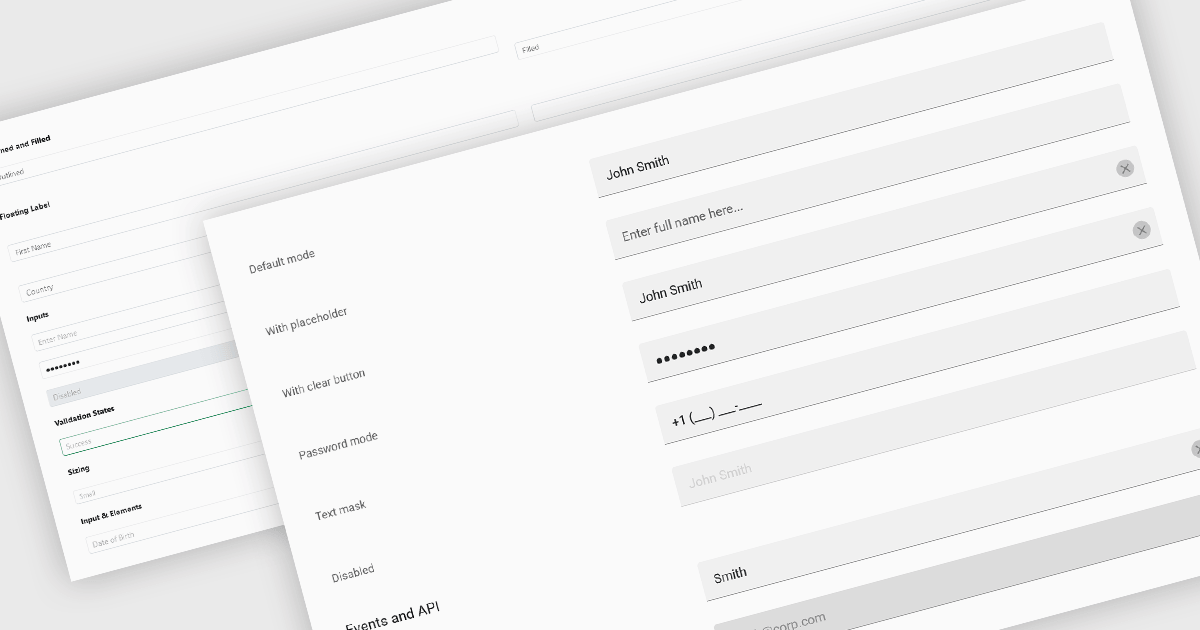
Text Box components in React Data Editors are interactive controls that allow users to input, edit, and manage textual data within a web interface. Designed to handle everything from single-line entries like names and titles to multi-line content such as comments or descriptions, these components are a core part of form-driven applications. They often include features like placeholder text, character limits, validation hooks, and integration with state management tools, which help ensure data quality and user-friendly interactions. Text Boxes are widely used in settings such as user registration forms, feedback systems, and content management interfaces, where accurate and flexible text input is essential to the application's functionality.
Several React data editor collections offer text box components including:
For an in-depth analysis of features and price, visit our React data editors comparison.
联系电话: (888) 850 9911
传真: +1 770 250 6199


