


官方供应商
我们作为官方授权经销商,直接提供超过200家开发厂家所发行超过1000个的产品授权给您。
查看我们的所有品牌。
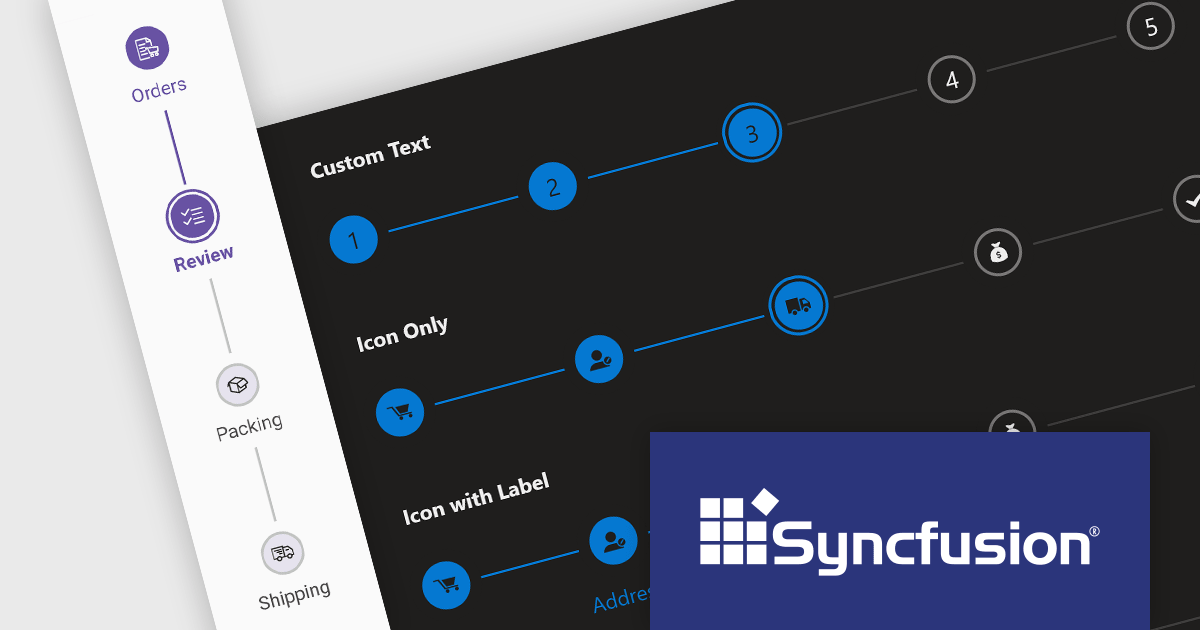
Syncfusion Essential Studio JavaScript, available as part of Syncfusion Essential Studio Enterprise, is a comprehensive UI library offering over 80 high-performance, lightweight, and responsive components to transform your web apps. Built from scratch with TypeScript, it boasts modularity and touch-friendliness, letting you pick and choose specific features while ensuring smooth mobile interaction. With rich themes, global accessibility features, and extensive documentation, it powers everything from basic buttons to interactive charts and data grids, simplifying front-end development across JavaScript, Angular, React, and Vue.
The Syncfusion Essential Studio JavaScript 2024 Volume 1 (25.1.35) release introduces the production-ready Stepper component which simplifies the creation of wizards and walkthroughs within your web applications. It provides a user-friendly interface to guide users through a step-by-step process, enhancing the overall user experience. The component offers a variety of step types, orientations, and customization options to perfectly suit your specific requirements.
To see a full list of what's new in version 2024 Volume 1 (25.1.35), see our release notes.
Syncfusion Essential Studio JavaScript is available as part of Syncfusion Essential Studio Enterprise which is licensed per developer starting with a Team License of up to five developers. It is available as a 12 Month Timed Subscription License which includes support and maintenance. See our Syncfusion Essential Studio Enterprise licensing page for full details.
For more information, visit our Syncfusion Essential Studio JavaScript product page.
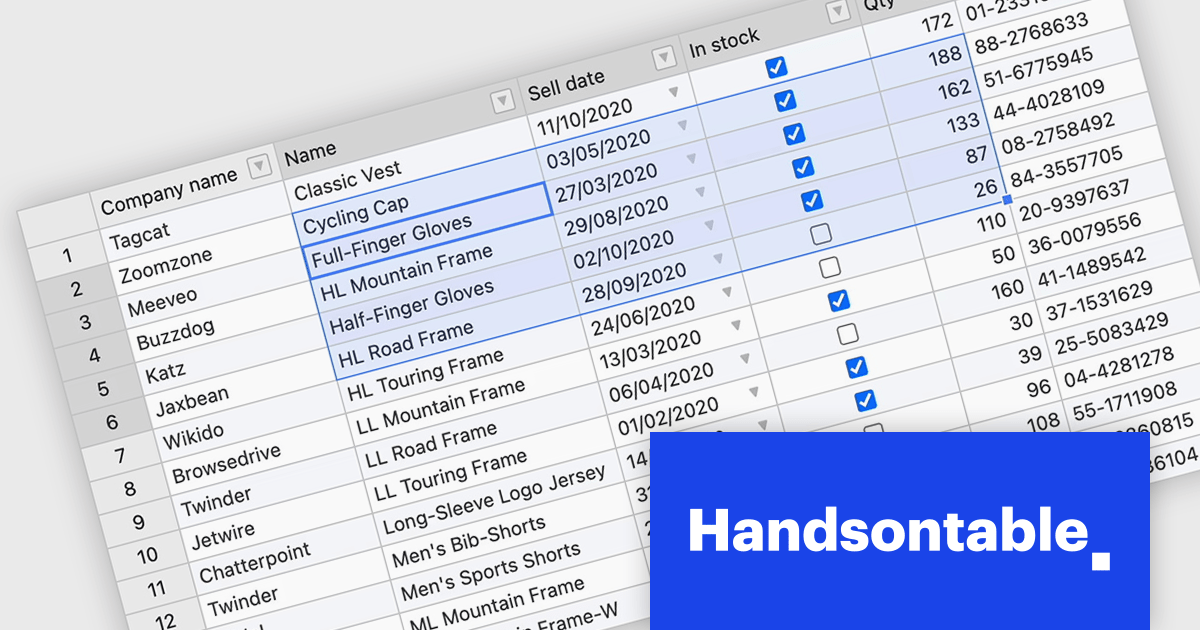
Handsontable is a JavaScript library designed to help developers build interactive data grids into their web applications. Offering a familiar spreadsheet-like interface, it allows users to edit, sort, and filter data with ease. Highly customizable and compatible with popular frameworks like React and Angular, Handsontable empowers developers to build robust data manipulation features into their web applications.
Handsontable 14.3 adds a new feature to streamline navigation within pre-selected cells. Power users and those accustomed to Tab navigation can now leverage arrow keys or the mouse for selection, then efficiently move between the chosen cells using Tab/Shift+Tab for horizontal movement and Enter/Shift+Enter for vertical movement. Editing remains intuitive, as typing any character initiates editing even within dropdown or date cells.
To see a full list of what's new in version 14.3.0, see our release notes.
Handsontable is licensed per developer and is available as an Annual or Perpetual license with 1 year support and maintenance. See our Handsontable licensing page for full details.
For more information, visit our Handsontable product page.
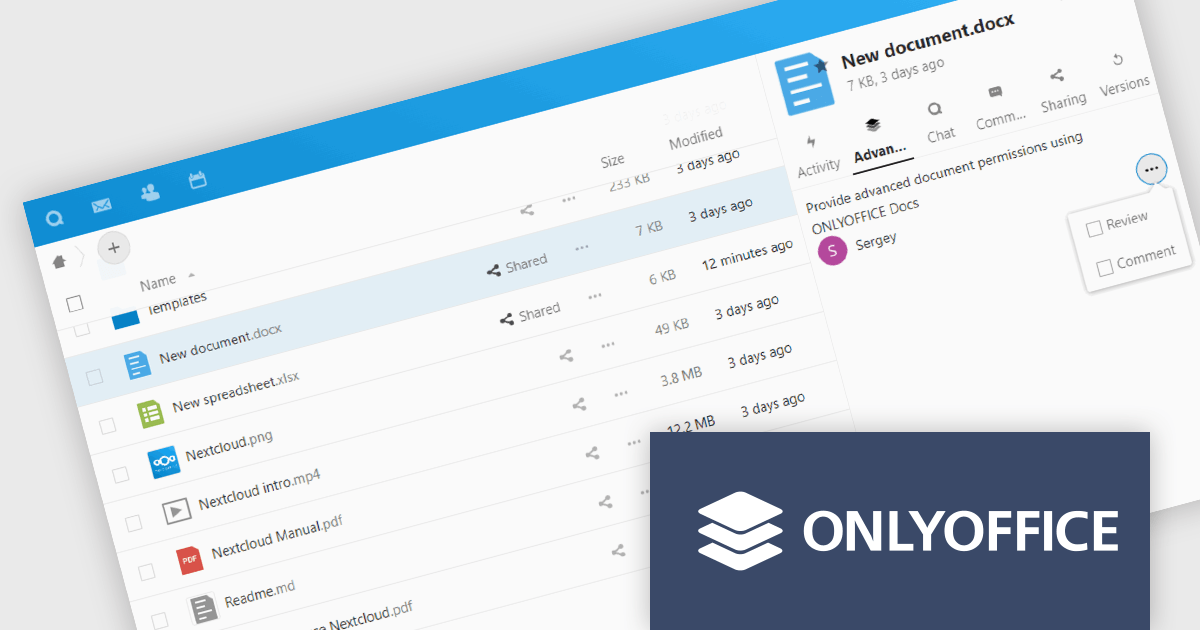
ONLYOFFICE Docs Enterprise Edition with Nextcloud Connector combines an online document editor with a seamless integration for Nextcloud, which is a open-source, on-premises content collaboration platform. This allows teams to create, view, edit, and collaborate on spreadsheets, presentations, and text files online, directly within Nextcloud, boosting efficiency and eliminating the need for file switching.
The ONLYOFFICE Nextcloud Connector v9.1 release (available as part of ONLYOFFICE Docs Enterprise Edition with Nextcloud Connector v8.0.1) brings enhanced security and granular control for developers working with public document sharing and Nextcloud Talk. Advanced access permissions for reviewing, commenting and custom filtering are now available for files with public access and for files created within the Nextcloud Talk app. These permissions ensure that external collaborators can contribute without compromising document integrity or security. It also promotes a more structured and controlled environment for real-time collaboration, ensuring that contributions are tracked and managed effectively according to the roles defined by the document owner.
To see a full list of what's new in ONLYOFFICE Docs Enterprise Edition v8.0.1 with Nextcloud Connector v9.1, see our release notes.
ONLYOFFICE Docs Enterprise Edition with Nextcloud Connector is licensed per server and is available as an annual license with 1 year of support and updates, or as a perpetual license with 3 years of support and updates. See our ONLYOFFICE Nextcloud connector licensing page for full details.
For more information, see our ONLYOFFICE Nextcloud connector product page.

ONLYOFFICE Docs Enterprise Edition with ownCloud Connector combines an online document editor with seamless integration for ownCloud, a real-time content collaboration platform. This allows teams to create, view, edit, and collaborate on spreadsheets, presentations, and text files directly within ownCloud, boosting efficiency and eliminating the need for file switching.
The ONLYOFFICE ownCloud Connector v9.1.1 release (available as part of ONLYOFFICE Docs Enterprise Edition with ownCloud Connector v8.0.1) introduces the ability to specify which users can access certain protected ranges, enhancing the granularity of permissions management within documents. By allowing administrators to define access at a more detailed level, it ensures that only designated users can view or modify specific parts of a document. This not only bolsters security by minimizing the risk of unauthorized access but also aids in compliance with stringent data protection standards. For developers, it simplifies the task of integrating advanced security measures into applications, providing a robust framework for managing document access in a collaborative setting.
To see a full list of what's new in ONLYOFFICE Docs Enterprise Edition v8.0.1 with ownCloud Connector v9.1.1, see our release notes.
ONLYOFFICE Docs Enterprise Edition with ownCloud Connector is licensed per server and is available as an annual license with 1 year of support and updates, or as a perpetual license with 3 years of support and updates. See our ONLYOFFICE ownCloud connector licensing page for full details.
For more information, see our ONLYOFFICE ownCloud connector product page.
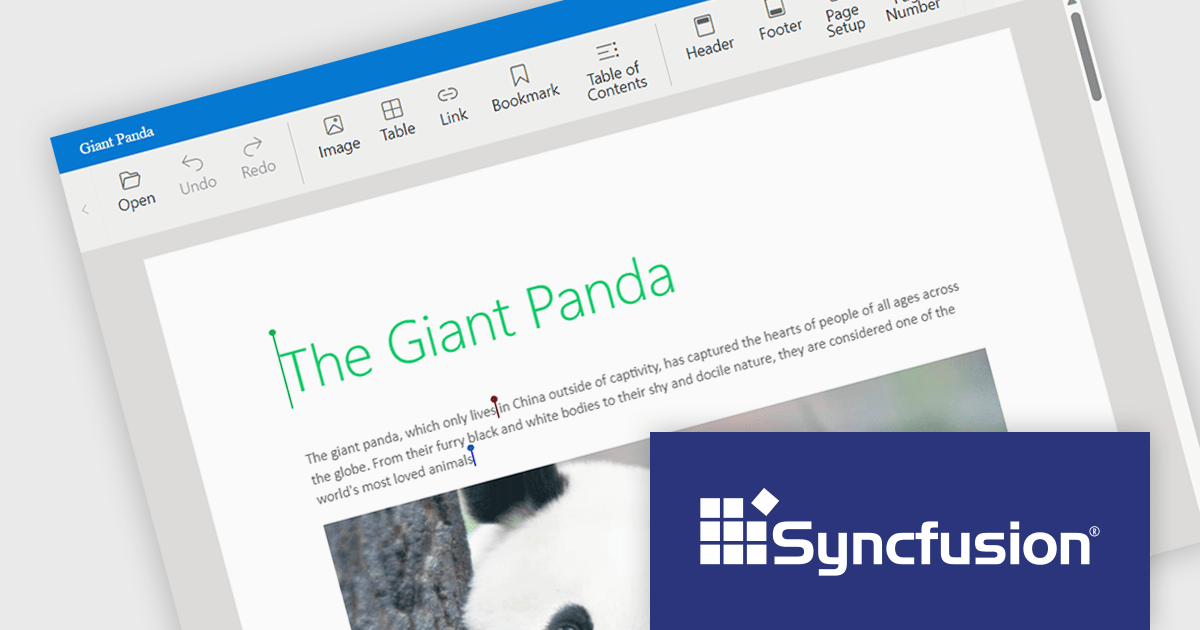
Syncfusion Essential Studio JavaScript, available as part of Syncfusion Essential Studio Enterprise, is a comprehensive UI library offering over 80 high-performance, lightweight, and responsive components to transform your web apps. Built from scratch with TypeScript, it boasts modularity and touch-friendliness, letting you pick and choose specific features while ensuring smooth mobile interaction. With rich themes, global accessibility features, and extensive documentation, it powers everything from basic buttons to interactive charts and data grids, simplifying front-end development across JavaScript, Angular, React, and Vue.
Syncfusion Essential Studio JavaScript 2024 Volume 1 (25.1.35) introduces real-time collaborative editing for the Word Processor component. This enables multiple users to co-author documents simultaneously, with changes visible to all participants as they happen. Collaborative editing streamlines the document workflow and fosters improved teamwork.
To see a full list of what's new in version 2024 Volume 1 (25.1.35), see our release notes.
Syncfusion Essential Studio JavaScript is available as part of Syncfusion Essential Studio Enterprise which is licensed per developer starting with a Team License of up to five developers. It is available as a 12 Month Timed Subscription License which includes support and maintenance. See our Syncfusion Essential Studio Enterprise licensing page for full details.
For more information, visit our Syncfusion Essential Studio JavaScript product page.
联系电话: (888) 850 9911
传真: +1 770 250 6199


