













官方供应商
我们作为官方授权经销商,直接提供超过200家开发厂家所发行超过1000个的产品授权给您。
查看我们的所有品牌。
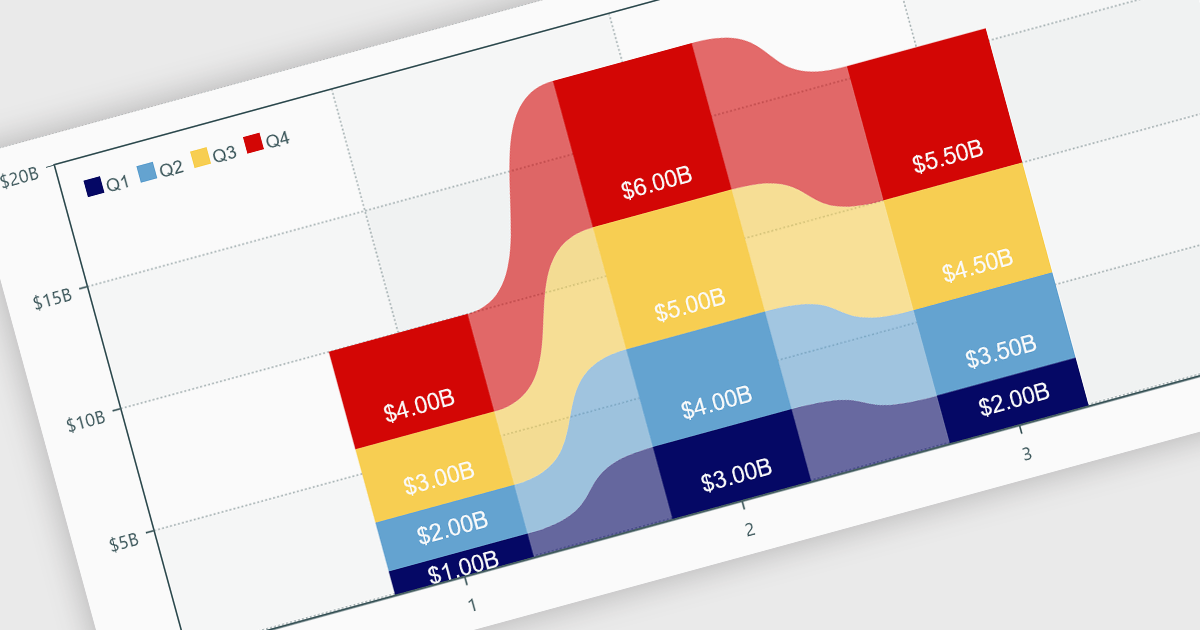
Charts within reports are graphical representations of data that allow users to visually interpret trends, comparisons, and patterns. They can take various forms, such as bar charts, line charts, or pie charts, and are typically integrated into dashboards or reporting tools to provide clear insights at a glance. By simplifying data visualization, charts enhance user experience and make it less taxing for users to understand complex information. Charts can be dynamically updated with real-time data, allowing for more responsive and insightful reporting in applications.
Several .NET WPF reporting controls offer support for charts including:
For an in-depth analysis of features and price, visit our comparison of .NET WPF Reporting controls.

jQWidgets is a comprehensive JavaScript UI framework offering a robust collection of over 60 widgets, themes, and utilities for building professional-grade, cross-platform web applications. Built on jQuery, HTML5, and CSS, it provides extensive functionality including data grids, charts, navigation, input validation, and more. jQWidgets simplifies web development, ensuring your applications work seamlessly across desktop browsers, tablets, and smartphones.
The jQWidgets v20.0.0 release introduces AI-powered sentence completion in its input component, enhancing user efficiency by suggesting autocompletions for full sentences based on context and how it has been configured.
To see a full list of what's new in v20.0.0, see our release notes.
jQWidgets is licensed per developer and is available as a Perpetual license 1 year support and maintenance. See our jQWidgets licensing page for full details.
Learn more on our jQWidgets product page.

Syncfusion Essential Studio .NET MAUI, available as part of Syncfusion Essential Studio Enterprise, empowers developers with a comprehensive suite of native UI controls, data visualization tools, and performance optimizations for building modern, cross-platform mobile and desktop applications. This professional-grade toolkit leverages the power of C# and XAML, enabling rapid development of stunning and responsive experiences across diverse platforms.
The Syncfusion .NET MAUI 2024 Volume 3 release introduces the preview of the AI AssistView control which enhances user interaction with AI services by offering a customizable interface. Key features include support for various content types (text, images, hyperlinks, and cards), customizable control templates, selectable response suggestions for smoother conversations, and advanced styling options for request and response items. These updates streamline app development and improve user engagement.
To see a full list of what's new in 2024 Volume 3, see our release notes.
Syncfusion Essential Studio .NET MAUI is available as part of Syncfusion Essential Studio Enterprise which is licensed per developer starting with a Team License of up to five developers. It is available as a 12 Month Timed Subscription License which includes support and maintenance. See our Syncfusion Essential Studio Enterprise licensing page for full details.
Learn more on our Syncfusion Essential Studio .NET MAUI product page.
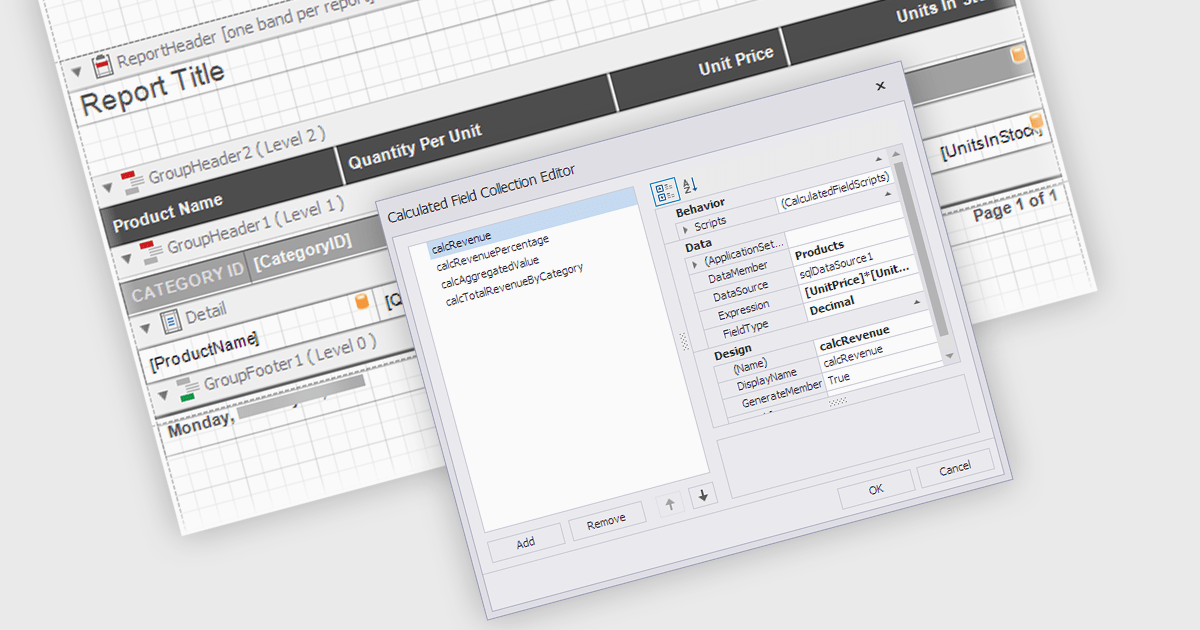
Calculated Fields in .NET WPF Reporting controls enable developers to dynamically compute values based on data from the report's dataset. These fields are not part of the original data source but are created by applying expressions, functions, or formulas to existing data. By leveraging calculated fields, developers can customize reports with real-time data manipulation, allowing for more sophisticated analysis and presentation without altering the underlying data model. The key benefits include reducing the need for external data processing, improving performance by handling computations within the report, and offering more flexibility in how data is displayed and interpreted.
Several .NET WPF reporting controls offer calculated field functionality including:
For an in-depth analysis of features and price, visit our comparison of .NET WPF Reporting controls.
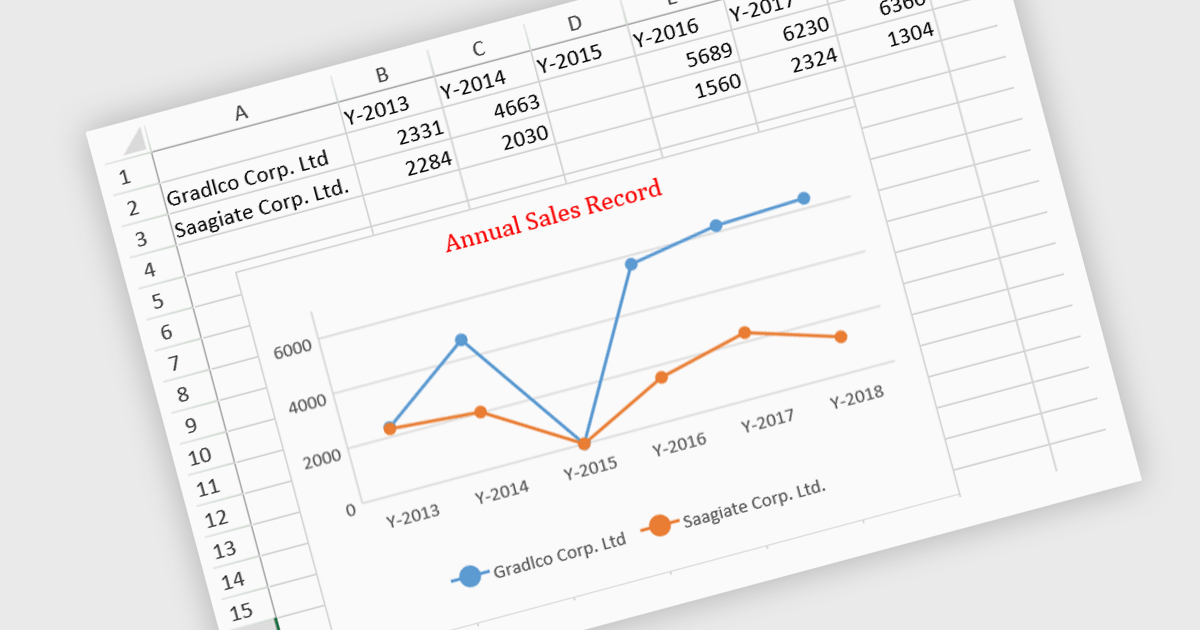
JavaScript spreadsheet controls with built-in chart features enable developers to visualize data directly within web-based spreadsheet applications. These charts are generated dynamically from the data within the spreadsheet, providing users with a more intuitive way to analyze and interpret complex datasets. By integrating charting capabilities, developers can offer real-time data visualization without relying on external libraries, resulting in more efficient user experiences. This functionality improves data-driven decision-making, enhances user engagement, and reduces the complexity of handling complex datasets in web applications.
Several JavaScript spreadsheet controls offer charts including:
For an in-depth analysis of features and price, visit our comparison of JavaScript Spreadsheet controls.
联系电话: (888) 850 9911
传真: +1 770 250 6199


