













官方供应商
我们作为官方授权经销商,直接提供超过200家开发厂家所发行超过1000个的产品授权给您。
查看我们的所有品牌。
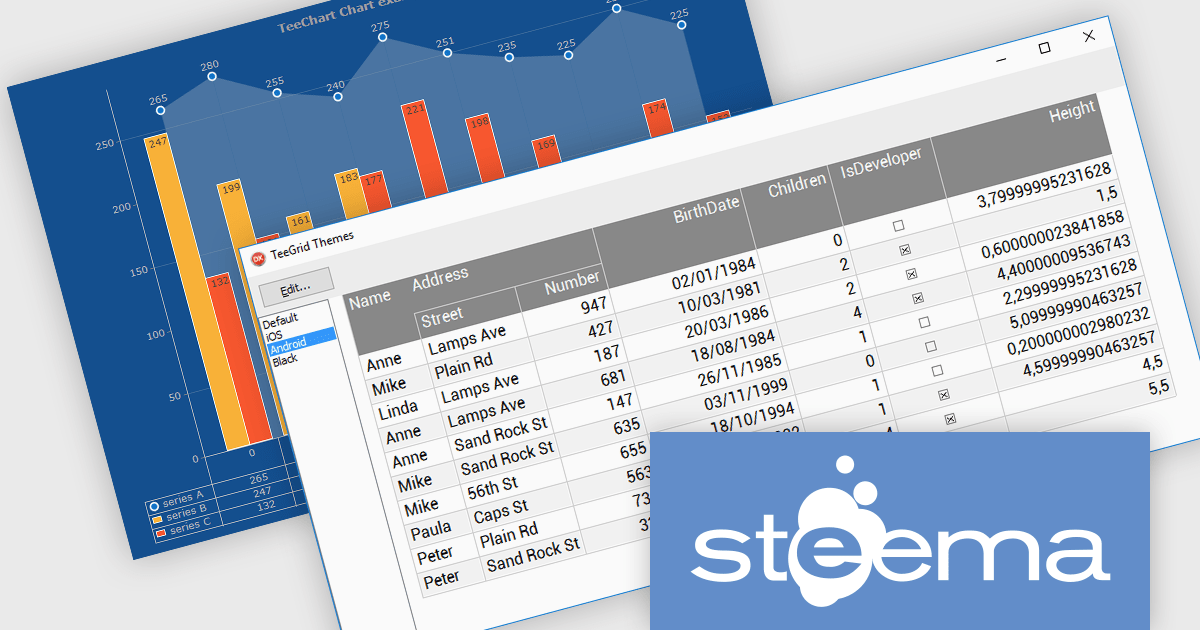
TeeChart Pro VCL/FMX is a comprehensive charting component library that empowers you to create visually stunning and informative data visualizations. With its vast array of chart types, including line, bar, pie, and scatter charts, and extensive customization options, TeeChart Pro caters to a wide spectrum of visualization needs.
TeeGrid VCL/FMX is a powerful and versatile grid component library for Delphi, C++Builder, and RAD Studio. It seamlessly handles tabular data presentation and management, offering flexible cell formatting, data binding, and extensive customization. Its lightweight and efficient nature makes TeeGrid VCL an ideal choice for a diverse array of applications.
Steema Software has announced that its TeeChart VCL 2024 (Build 2024.41.240913) and TeeGrid VCL v1.16 releases are now fully compatible with RAD Studio 12.2 Athens (Delphi and C++Builder). This release enhances the development experience by ensuring compatibility with the latest features and optimizations of Embarcadero’s IDEs. Developers can fully leverage TeeChart's comprehensive charting tools and TeeGrid's efficient data grid capabilities whilst benefiting from the performance improvements of RAD Studio 12.2. It ensures smoother workflows, better performance, and access to the latest Delphi and C++ Builder features, thus enabling developers to build modern, responsive, and visually appealing applications across multiple platforms.
Steema VCL products are licensed per developer and include a one year subscription for minor and major updates plus access to technical support. Priority support is also available. For more information see our licensing pages for TeeChart Standard VCL/FMX, TeeChart Pro VCL/FMX, TeeGrid VCL/FMX, and TeeSuite for RAD Studio.
Learn more on our Steema VCL product pages:
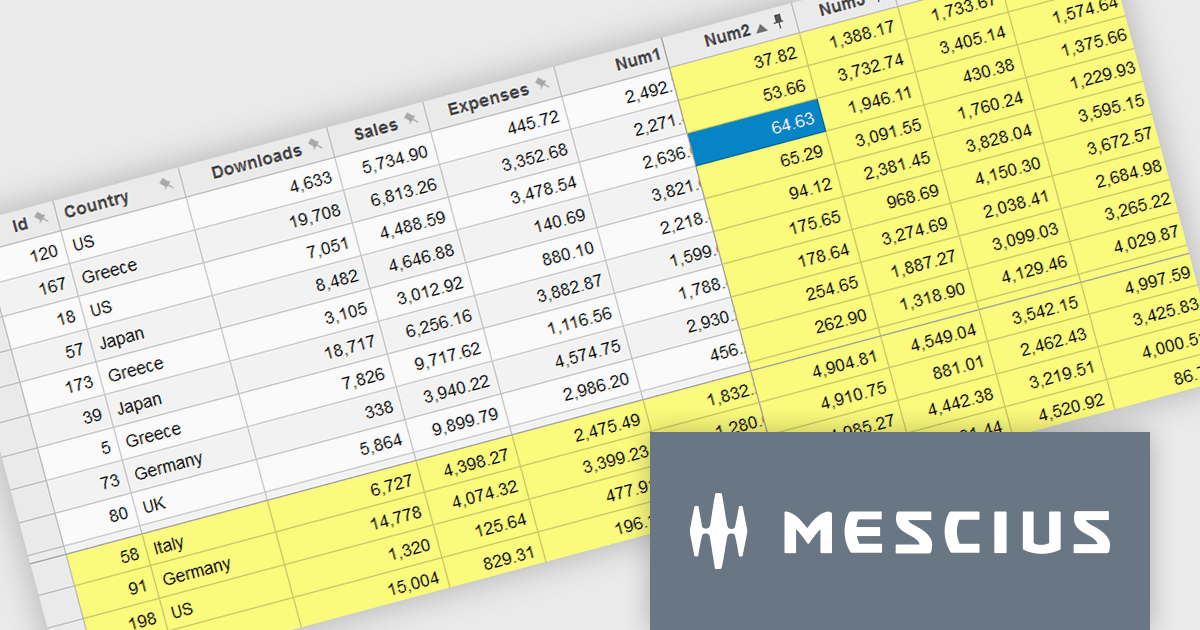
Wijmo by MESCIUS is a comprehensive JavaScript library offering a suite of high-performance UI components and data grids specifically designed to streamline the development of modern enterprise applications. It emphasizes reduced development time and improved maintainability, along with a focus on performance through its efficient design and small module size. Wijmo integrates seamlessly with popular JavaScript frameworks like Angular, React, and Vue.js, and supports cutting-edge technologies like TypeScript, making it a versatile solution for building complex web applications.
The Wijmo 2024 v2 update improves FlexGrid with the ability to freeze and pin columns to the right and rows to the bottom. Previously, freezing was limited to the left side for columns and the top for rows. Experience greater flexibility and improved data presentation with the ability to freeze cells in any direction. This feature streamlines data analysis by keeping critical rows and columns visible, enhancing usability and allowing users to focus on key information. With a more intuitive interface, users enjoy a seamless experience, leading to higher satisfaction and a more professional software tool.
To see a full list of what's new in 2024 v2 (Build 5.20242.21), see our release notes.
Wijmo is licensed per developer. Developer Licenses are perpetual and include 1 year Subscription which provides upgrades, including bug fixes and new features. See our Wijmo licensing page for full details.
Learn more on our Wijmo product page.

Grial UI Kit by UXDivers is a collection of pre-designed user interface components and templates specifically built for Xamarin.Forms and .NET MAUI app development. It offers a wide range of customizable XAML code snippets, custom controls, and helpers, allowing developers to rapidly build modern and visually appealing mobile applications for Android and iOS platforms while focusing on the core functionalities of the app.
The Grial UI Kit 2024.4 release adds a new Task Flow interface which offers three interconnected pages for a comprehensive view of summarized and detailed data, such as employees, tasks, and performance. Though it features employee data by default, it is highly customizable. Thanks to the flexibility of bindings and the MVVM pattern, you can easily replace the sample content with your own, making it adaptable for various use cases like project tracking and performance analysis.
To see a full list of what's new in 2024.4 (version 4.2.117.0), see our release notes.
Grial UI Kit is licensed per application and is available as an perpetual license. See our Grial UI Kit licensing page for full details.
For more information, see our Grial UI Kit product page.
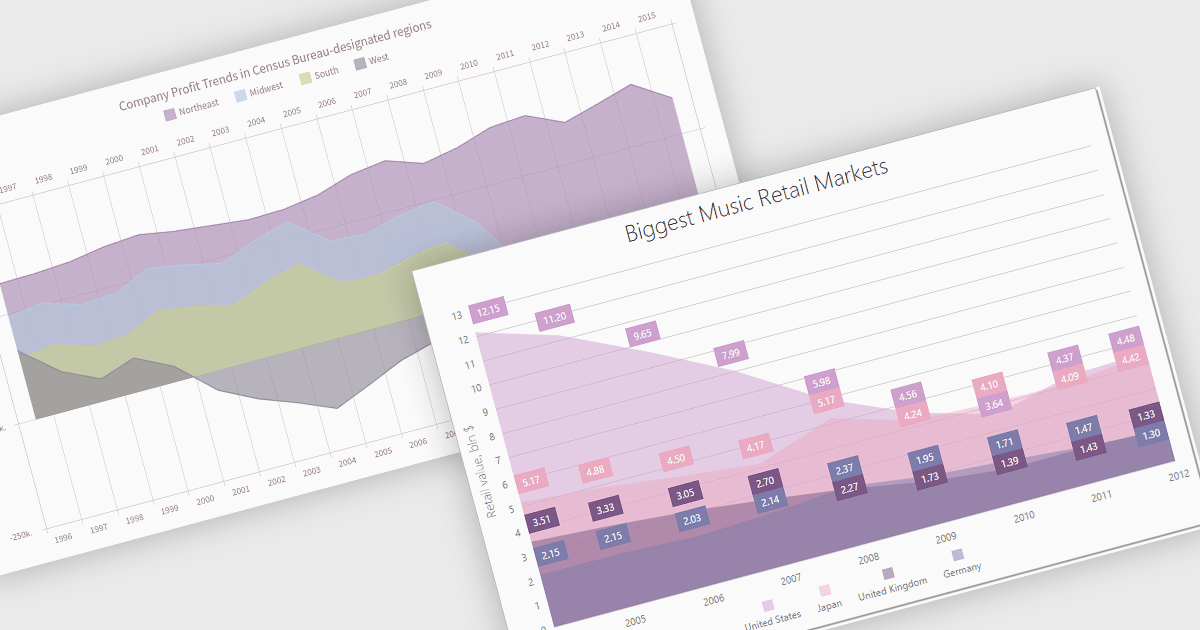
An area chart is a visualization tool that displays data as a filled area bounded by a line and the x-axis. It's particularly effective for illustrating trends and changes in data over time. By filling the area beneath the line, it visually represents the cumulative value of the data, making it easier to understand overall trends. This makes area charts ideal for visualizing metrics like sales over time, inventory levels, or stock prices.
Several Angular chart controls offer area charts including:
For an in-depth analysis of features and price, visit our Angular chart controls comparison.
JetBrains YouTrack is a versatile project management and collaboration tool designed for both software development and non-technical teams. Powered by a robust and flexible issue tracking core, YouTrack provides comprehensive features for managing tasks, projects, and workflows of any size. Its intuitive interface fosters efficient collaboration and communication, while agile boards and reporting tools offer real-time visibility and control. Available in both cloud and on-premises options, YouTrack scales effortlessly to accommodate small startups and large enterprises alike, making it a powerful solution for teams seeking to streamline their work and boost productivity.
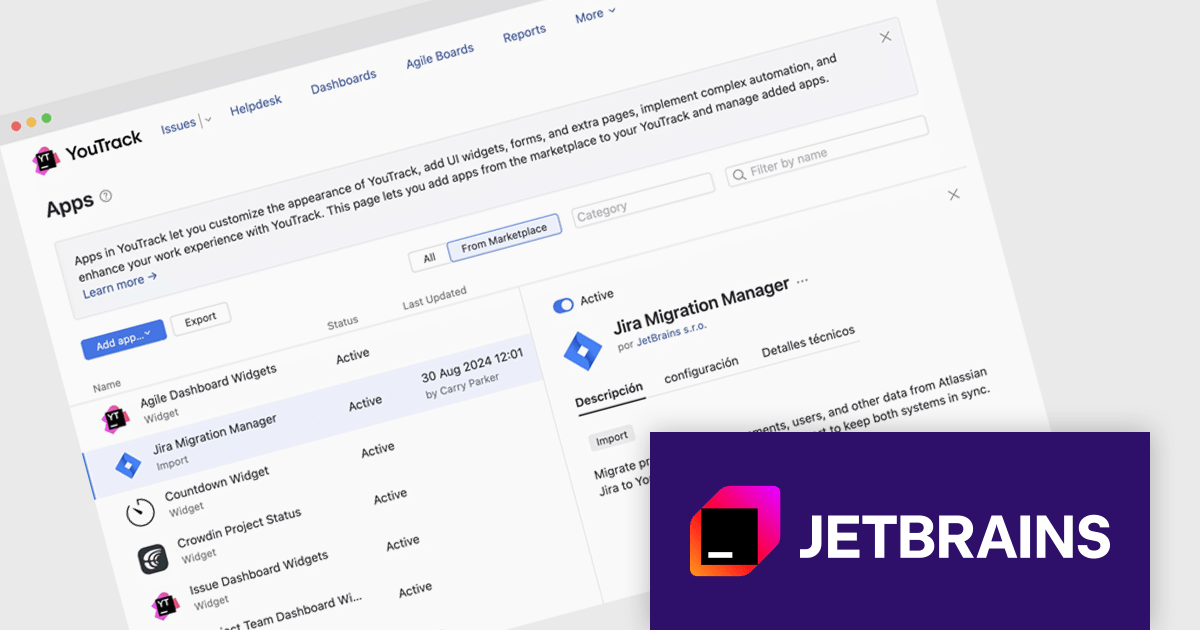
The YouTrack 2024.3 release now allows you to extend its functionality with a variety of apps, enabling the addition of new features, tools, and integrations beyond the standard offering. These apps let teams customize YouTrack to fit their specific needs, enhancing project management, reporting, automation, and integration with other software. If YouTrack is missing a feature you need, you can now consider building an app to extend its functionality.
To see a full list of what's new in version 2024.3, see our release notes.
YouTrack Server (installed on your server) is licensed per server and per user, as a Perpetual license with 1 year of free updates and technical support. YouTrack Cloud (hosted in the cloud by JetBrains) is licensed per user as an Annual license with free updates and technical support. See our YouTrack licensing page for full details.
For more information, visit our YouTrack product page.
联系电话: (888) 850 9911
传真: +1 770 250 6199


