













官方供应商
我们作为官方授权经销商,直接提供超过200家开发厂家所发行超过1000个的产品授权给您。
查看我们的所有品牌。
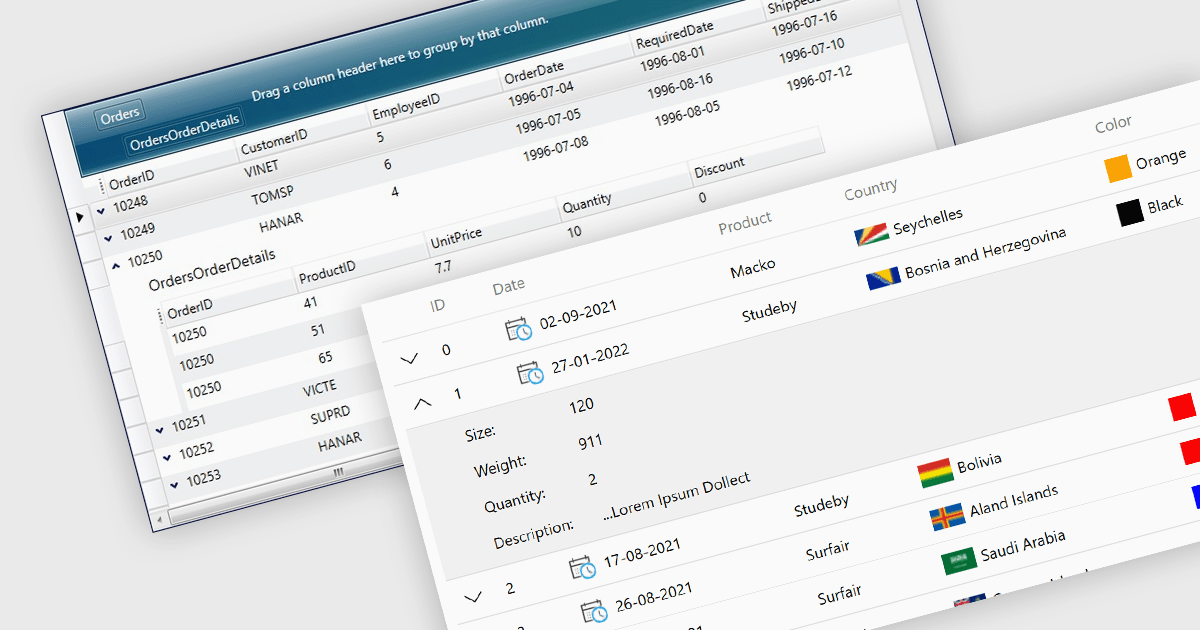
Master-detail is a user interface design technique where a primary data set (the master) is displayed in a grid format, and related information (the detail) is typically shown in an adjacent pane when a master item is selected. The resulting hierarchical structure allows users to efficiently navigate and explore complex data sets by viewing high-level information in the master grid while accessing more granular details on demand, without navigating away from the main page. The master-detail view enhances the user experience as it improves the organization of the grid and streamlines workflows as users can quickly switch between records and details.
Several .NET 8 WPF grid components offer support for master-detail, including:
For an in-depth analysis of features and price, visit our comparison of .NET 8 WPF grid components.
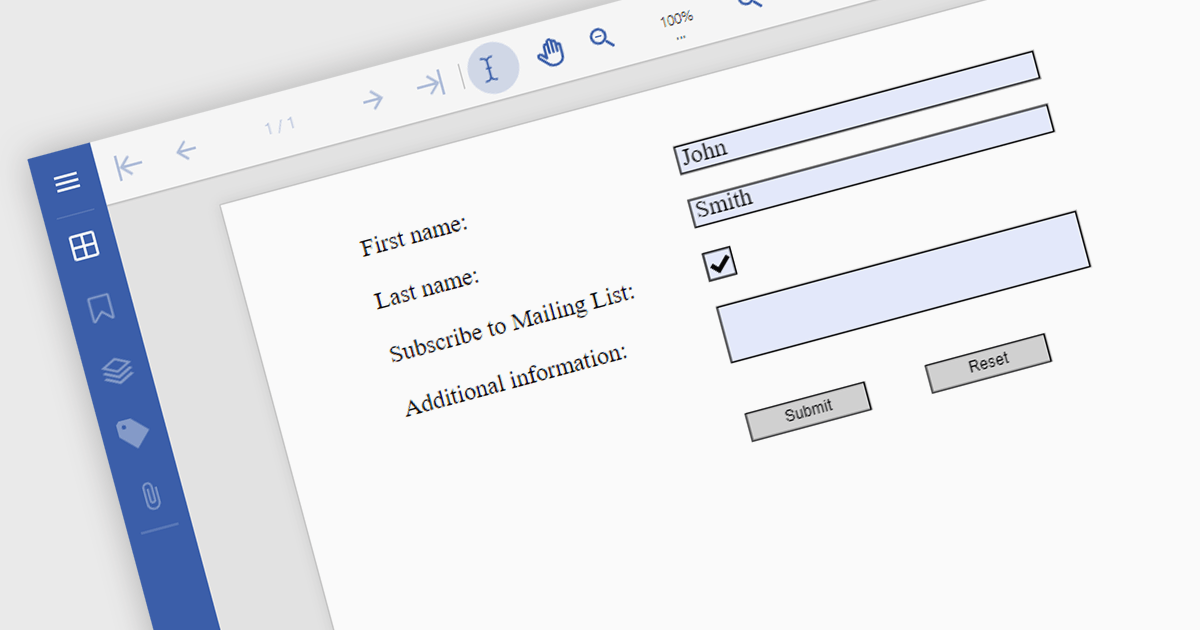
Submit actions in PDF components allows developers to define specific actions to be triggered when a user submits a form filled with data. These actions can range from sending an email with the collected data to integrating with external systems or databases. By implementing submit actions, developers can create interactive and dynamic PDF forms that automate processes, improve efficiency, and enhance user experience.
Several .NET PDF components offer submit action including:
For an in-depth analysis of features and price, visit our comparison of .NET PDF components.
DataGrip is a multi-engine database environment that supports MySQL, PostgreSQL, Microsoft SQL Server, Oracle, Sybase, DB2, SQLite, HyperSQL, Apache Derby and H2. It includes an editor that provides intelligent coding assistance such as auto-completion, analysis and navigation. It also features a query console for running and profiling queries.
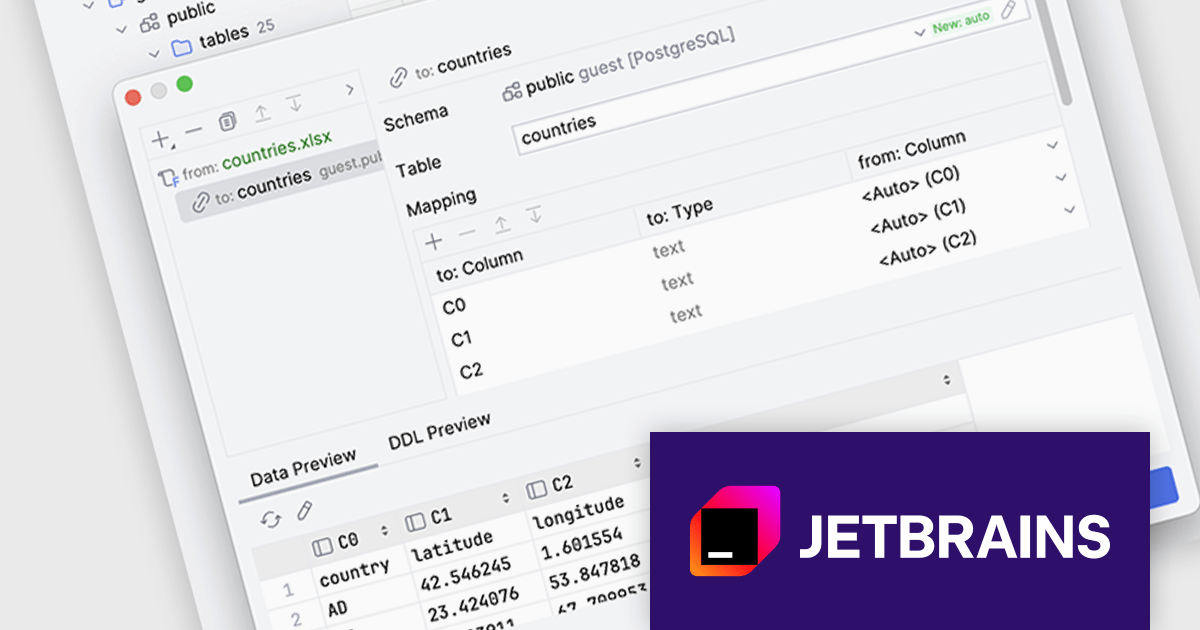
The DataGrip 2024.2 release revolutionizes the way users import data from tabular files. By supporting a range of file types, including Excel, JSON, Parquet, and Shapefile, DataGrip offers a flexible solution for data analysts and developers. Users can now tailor the import process to their exact requirements, ensuring seamless integration of data into their projects.
To see a full list of what's new in version 2024.2, see our release notes.
DataGrip is licensed per user, and is available as a commercial annual subscription license. We can supply new subscriptions, subscription renewals (including continuity discounts), lapsed renewals, and additional user licenses. See our DataGrip licensing page for full details.
DataGrip is available to buy in the following products:
Skyvia Automation is a cloud-based platform designed to streamline and automate data-driven processes. It offers a user-friendly interface that allows users to create and manage complex workflows without requiring extensive coding knowledge. By connecting various applications and data sources, Skyvia Automation enables organizations to automate repetitive tasks, synchronize data across systems, and streamline business operations, ultimately improving efficiency and productivity.
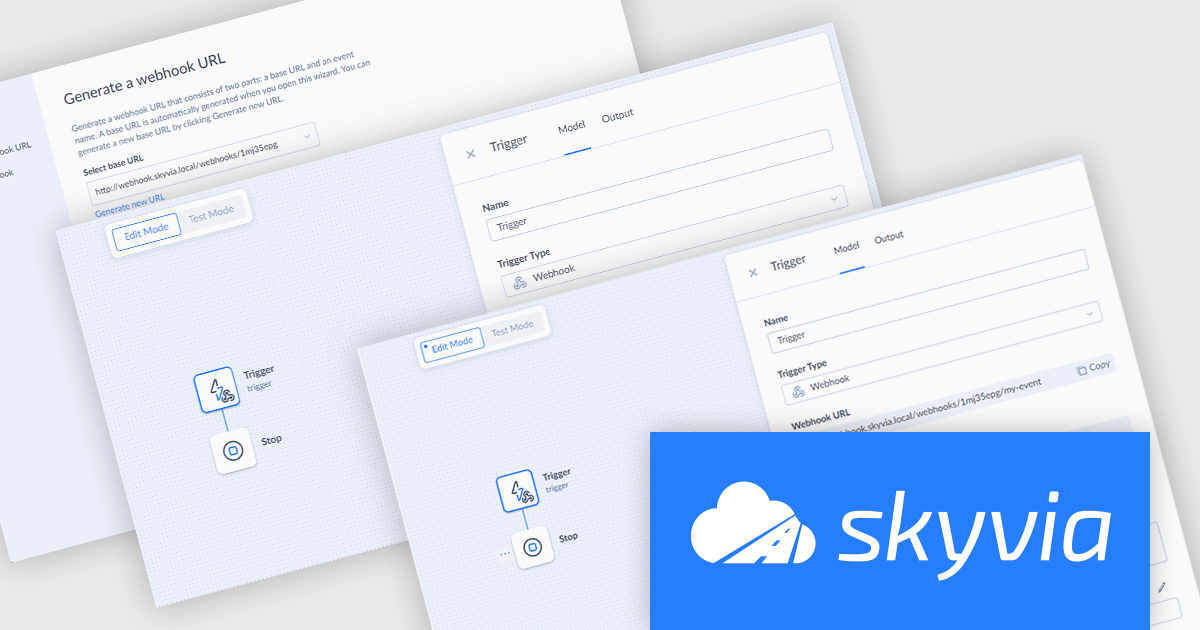
The latest release of Skyvia Automation introduces Webhook Triggers, allowing users to initiate automations from external sources. Once a Webhook Trigger is set up, Skyvia generates a unique webhook URL, which can be called from any external application or service, prompting Skyvia to immediately execute the associated automation upon receiving the request.
To see a full list of what's new in the latest release, see our release notes.
Skyvia Automation is licensed based on the number of tasks per month and is available as an Annual License. See our Skyvia Automation licensing page for full details.
Learn more on our Skyvia Automation product page.

Pie charts are circular diagrams that visually represent data as slices of a whole. Each slice represents a category, with its size proportional to its share of the total. They are particularly effective for illustrating categorical data, such as market shares, demographics, or budget allocations. Pie charts offer a clear and intuitive way to compare relative quantities, making it easy to identify the dominant categories and their contributions to the overall composition.
Several React chart controls offer pie charts including:
For an in-depth analysis of features and price, visit our React chart controls comparison.
联系电话: (888) 850 9911
传真: +1 770 250 6199


