













官方供应商
我们作为官方授权经销商,直接提供超过200家开发厂家所发行超过1000个的产品授权给您。
查看我们的所有品牌。
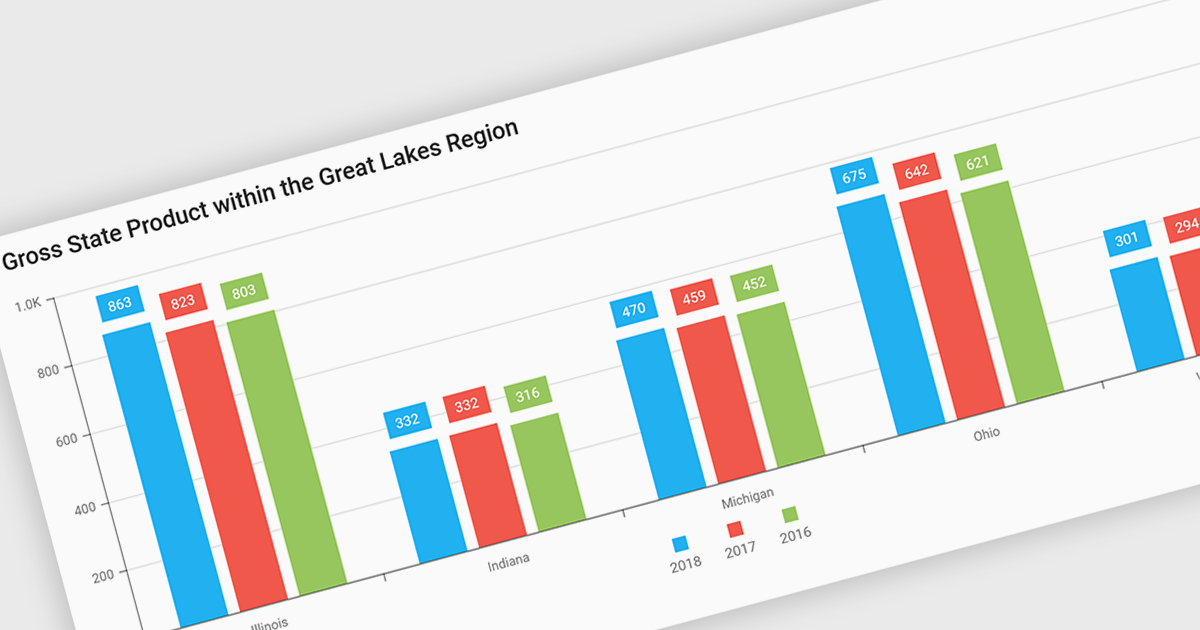
Bar and column charts, though sometimes referred to interchangeably, are vital tools for visualizing data within software applications. Their simple format, with bars representing categories and their lengths proportional to corresponding values, allows users to quickly grasp comparisons between different data sets. This makes them ideal for dashboards displaying sales figures across regions, project management tools tracking task completion rates, or any scenario where users need to compare metrics at a glance. Their effectiveness lies in their ability to present complex information in a clear and concise manner, facilitating informed decision-making within software applications.
Several React Chart controls offer column and bar charts including:
For an in-depth analysis of features and price, visit our React Chart controls comparison.
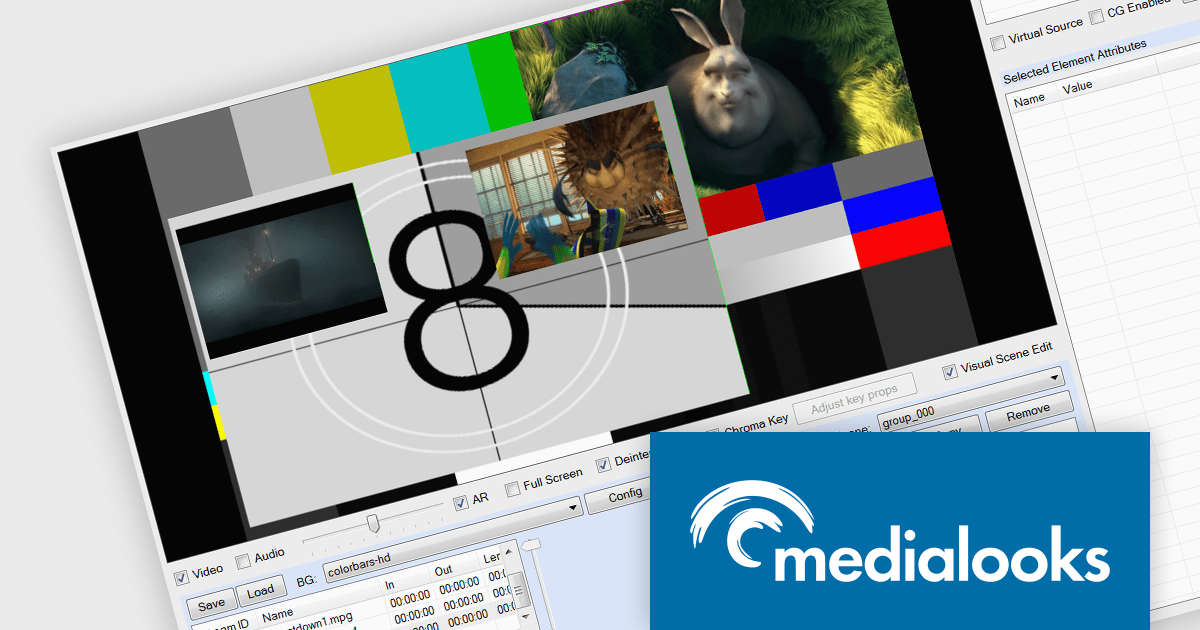
Medialooks Video SDKs (MFormats SDK and MPlatform SDK) are versatile and professional multimedia software development kits. Supporting C#, C++, VB.NET, and Embarcadero Delphi, they are designed to simplify the integration of video processing and streaming capabilities into multimedia applications, providing a comprehensive functionality for video ingestion, playout, mixing, and streaming. MFormats SDK offers granular control over video frames and audio samples, making it ideal for applications that require direct manipulation of media content. MPlatform SDK provides higher-level functionalities such as playlist management, multi-channel recording, and gapless playback, tailored for broadcasters and live production scenarios.
The Medialooks Video SDK v2.9.0.13880 update introduces the ability to record multiple video streams into a single MP4 file, streamlining post-production and multi-stream workflow management. This eliminates the need for separate recordings per stream, simplifying synchronization and editing, especially beneficial in live broadcasting or multi-camera setups where handling numerous streams can be labor-intensive. This functionality enhances media application efficiency and scalability by fostering a more cohesive recording environment.
To see a full list of what's new in v2.9.0.13880, see our release notes:
Medialooks Video SDKs are licensed per developer and are available as a perpetual license with 1 year support and maintenance. See our licensing pages for full details:
Medialooks Video SDK is available as the following products:
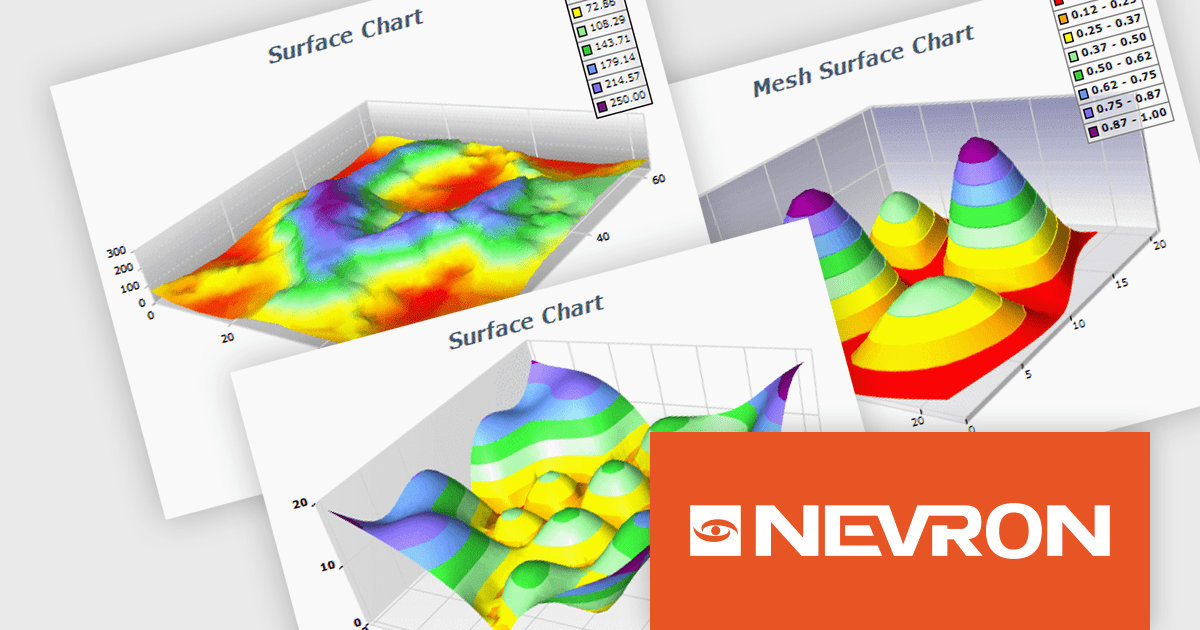
NOV Chart for .NET by Nevron is a comprehensive .NET charting component suite designed for cross-platform application development. It offers an array of 2D and 3D chart types, along with smart data labeling, an advanced chart axes model, numerous interactivity features and GPU-accelerated real-time rendering based on OpenGL. This library allows developers to seamlessly integrate rich, dynamic and interactive business, scientific, financial and presentation data visualizations into their .NET applications for more effective communication.
The NOV Chart for .NET 2024.1 update expands its surface series capabilities to include support for Grid Surface, Mesh Surface, Triangulated Surface, and Vertex Surface series types. Supporting custom colors per vertex, mesh and contour lines, flat contour rendering, real time, shader optimized rendering, and more, each series type offers unique capabilities for depicting data. This enables developers to deliver richer, more informative visual analytics, catering to a wide range of professional and scientific needs.
To see a full list of what's new in 2024.1, see our release notes.
NOV Chart for .NET is licensed per developer and is available as a perpetual license with 1 year support and maintenance. See our NOV Chart for .NET licensing page for full details.
NOV Chart for .NET is available in the following products:
SecureBlackbox by /n software is a collection of software components designed to enhance your applications' data security. It provides functionalities for data protection through encryption and hashing, secure storage with key management, and secure transfer using protocols like SFTP and TLS. SecureBlackbox offers granular control over these features, allowing you to tailor security measures to your specific application requirements.
The SecureBlackbox 2024 update offers comprehensive support for the latest version of OpenPGP, PGP v6. This improved version introduces two key advancements: EdDSA (Edwards-curve Digital Signature Algorithm) for creating digital signatures and AEAD (Authenticated Encryption with Associated Data) for enhanced encryption. These improvements provide both stronger security and increased performance for data protection.
To see a full list of what's new in SecureBlackbox 2024, see our release notes.
SecureBlackbox is available as part of /n software Red Carpet Subscription. Red Carpet Subscription is licensed per developer and is available as a Perpetual License with a 12 month support and maintenance subscription. See our Red Carpet Subscription licensing page for full details.
SecureBlackbox is available to buy in the following products:
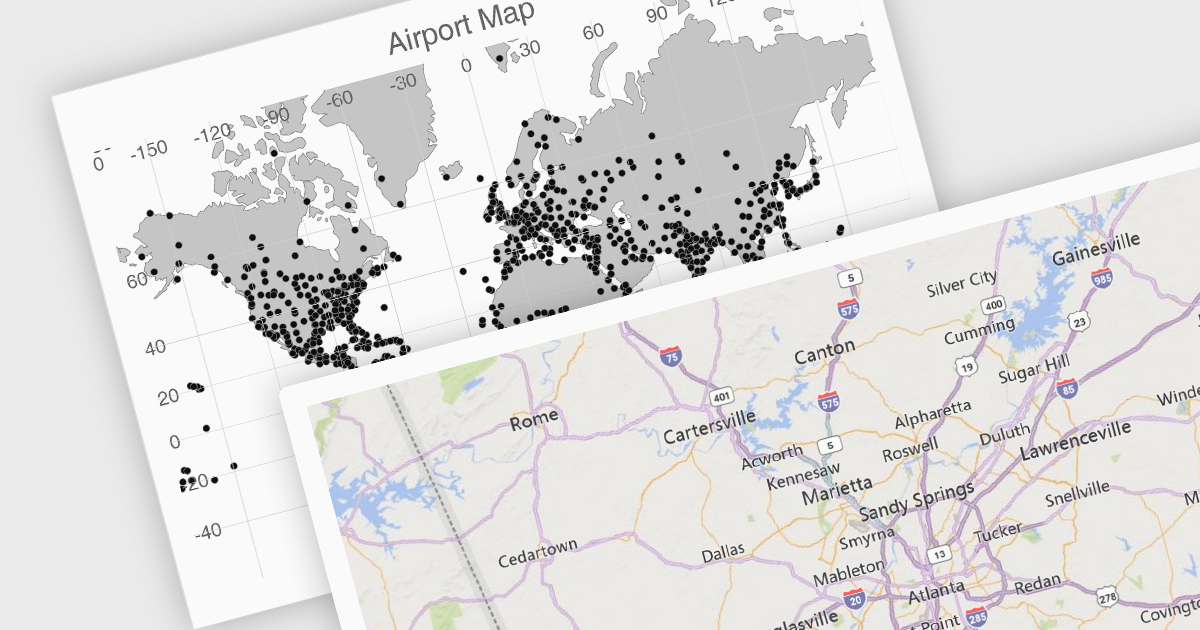
UI suites often include map components that streamline the development process for applications displaying geographical data. These components integrate seamlessly with the chosen framework, offering features like base map selection, zoom controls, and location markers. They can be customized to display real-time data visualizations, allowing users to explore trends and patterns across geographic regions. This functionality is valuable for applications in logistics, e-commerce, and any industry where location plays a key role.
Several Vue.js UI suites offer mapping functionality, including:
For an in-depth analysis of features and price, visit our comparison of Vue.js UI suites.
联系电话: (888) 850 9911
传真: +1 770 250 6199


