













官方供应商
我们作为官方授权经销商,直接提供超过200家开发厂家所发行超过1000个的产品授权给您。
查看我们的所有品牌。
DevExtreme Complete by DevExpress is a collection of high-performance, pre-built UI components designed for web and mobile app development. It offers a rich set of widgets including data grids, charts, editors, and navigation tools that are responsive and work seamlessly across different browsers and devices. DevExtreme Complete allows developers to build feature-rich and user-friendly applications for modern web experiences.
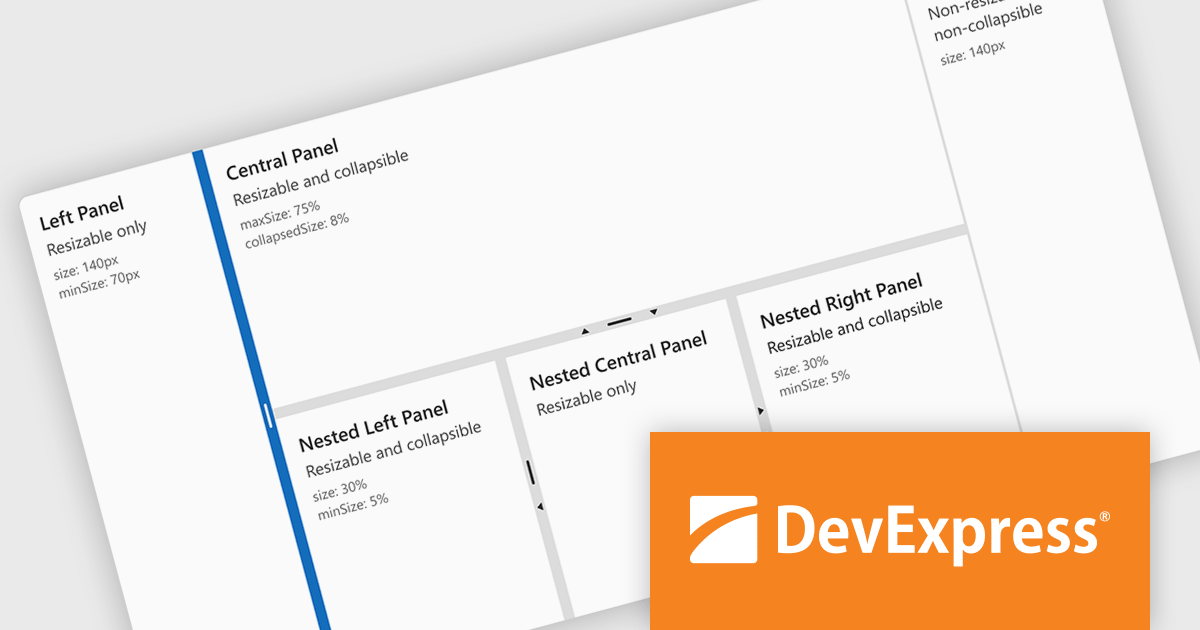
DevExtreme Complete 24.1 adds a new splitter component. This powerful addition allows you to create flexible page layouts with resizable and collapsible panes. Panes can be oriented horizontally or vertically and can contain various content types, including HTML and other DevExtreme components. The splitter offers customization options for handle size, appearance, and keyboard accessibility, making it a powerful tool for building adaptable web applications.
To see a full list of what's new in version 24.1, see our release notes.
DevExtreme Complete is licensed per developer and is available as a Perpetual License with a 12 month support and maintenance subscription. We can supply any DevExtreme Complete license including new subscriptions, subscription renewals, expired subscription renewals, and additional licenses. See our DevExtreme Complete licensing page for full details.
DevExtreme Complete is available to buy in the following products:
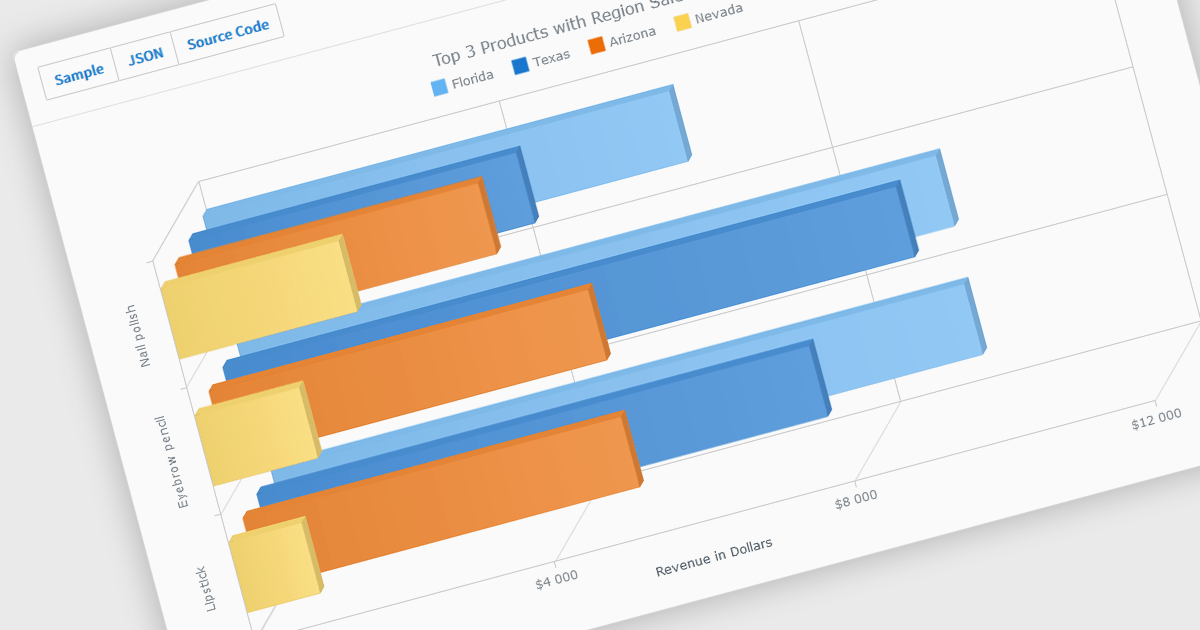
A selection of jQuery chart controls offer 3D capabilities, allowing data visualization to extend beyond the flat plane. This enables a more immersive and engaging user experience, particularly for complex datasets. Three-dimensional charts can be beneficial for highlighting patterns and relationships between multiple variables, making them ideal for scientific visualizations, financial data representation, or showcasing product features in a unique way.
Several jQuery chart controls offer 3D charts including:
For an in-depth analysis of features and price, visit our comparison of jQuery chart controls.

Conditional formatting in a spreadsheet component allows you to dynamically alter the visual appearance of cells based on predefined rules. This functionality enhances data readability by highlighting specific values or trends within your spreadsheet. By visually differentiating critical information, conditional formatting empowers developers to create more user-friendly and informative data presentations within their ASP.NET applications.
Several ASP.NET Core Assembly Spreadsheet Controls offer Conditional Formatting including:
For an in-depth analysis of features and price, visit our comparison of ASP.NET Core Assembly Spreadsheet Controls.
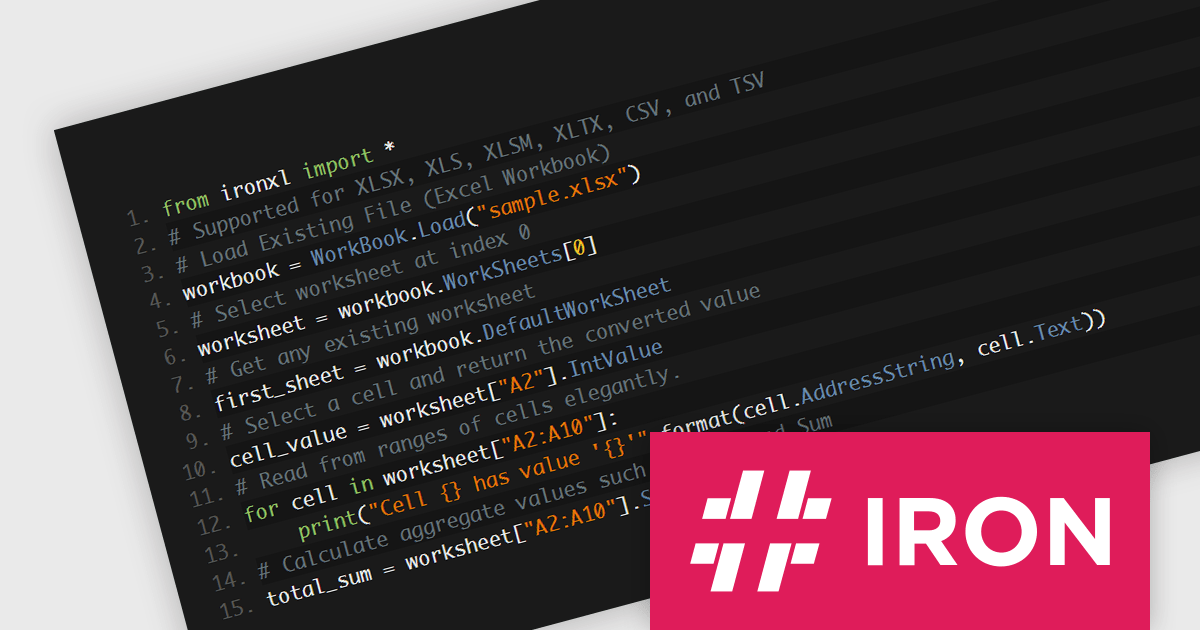
IronXL for Python via .NET by Iron Software is a Python Excel library designed to enable Python developers to manipulate, read and generate Microsoft Excel files easily by leveraging the .NET framework. It allows them to integrate Excel functionality into Python applications without requiring Microsoft Office or Excel Interop to be installed on the server or client machines. This standalone solution provides a comprehensive API for reading, creating, and editing Excel files (XLS, XLSX, XLSM, CSV, TSV, etc.) directly from Python code.
IronXL offers a compelling alternative for developers seeking an efficient and versatile solution for spreadsheet manipulation in Python environments. It facilitates the automation of report generation, data analysis, and financial modeling, all within a familiar Excel format but executed through Python scripts. It simplifies complex tasks like data import/export, formatting control, and chart generation, making it ideal for automating spreadsheet-related workflows across various industries, from data analysis and reporting to financial modeling and content generation. The use cases for IronXL span various industries including finance, research, education, and healthcare, where users need to merge, split, and export data while maintaining the integrity and formatting of their spreadsheets.
IronXL for Python via .NET is licensed based on the number of developers, organization locations and projects, and is available as a perpetual license with one free year of product updates and support services. See our IronXL for Python via .NET licensing page for full details.
For more information, see our IronXL for Python via .NET product page.
LightningChart .NET is a high-performance data visualization library designed for .NET developers working with WPF, WinForms, and UWP applications. It offers GPU-accelerated rendering for smooth real-time visualization of massive datasets, exceeding billions of data points. This library supports a wide variety of chart types, including 2D, 3D, polar, and geographic maps, along with extensive customization options for each. LightningChart .NET is a powerful tool for developers creating demanding data visualization applications requiring exceptional performance.
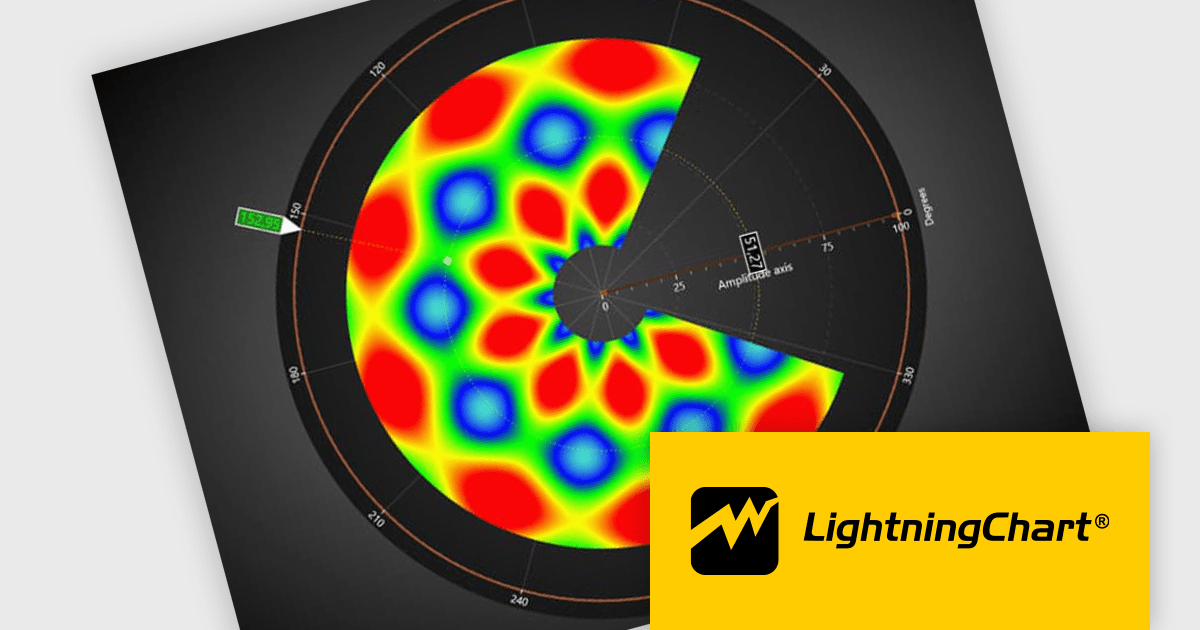
The LightningChart v12 update introduces the Polar Heatmap / IntensityGrid series (IntensityGridSeriesPolar), specifically designed for visualizing complex polar data with intensity values. Polar Heatmap charts utilizes a circular coordinate system to visualize data. One axis represents angles (thetas) while the other, known as amplitude, represents the distance from a central point (radii). Color intensity encodes the data values, effectively creating a circular heatmap that reveals both directional trends (angles) and variations in magnitude (amplitude) within the data. This chart type excels at analyzing cyclical or angular data, making it ideal for applications like wind speed and direction or seasonal variations throughout the year.
To see a full list of what's new in v12.0, see our release notes.
LightningChart .NET is available per developer in packages for either WPF, WinForms, UWP or all 3. Each package comes as a subscription license (with 1 or 2 years of limited support), or a perpetual license (with 1 or 2 years of Standard or Premium support). Floating licenses and site licenses are available upon request. See our LightningChart .NET licensing page for full details.
Learn more on our LightningChart .NET product page.
联系电话: (888) 850 9911
传真: +1 770 250 6199


