


官方供应商
我们作为官方授权经销商,直接提供超过200家开发厂家所发行超过1000个的产品授权给您。
查看我们的所有品牌。
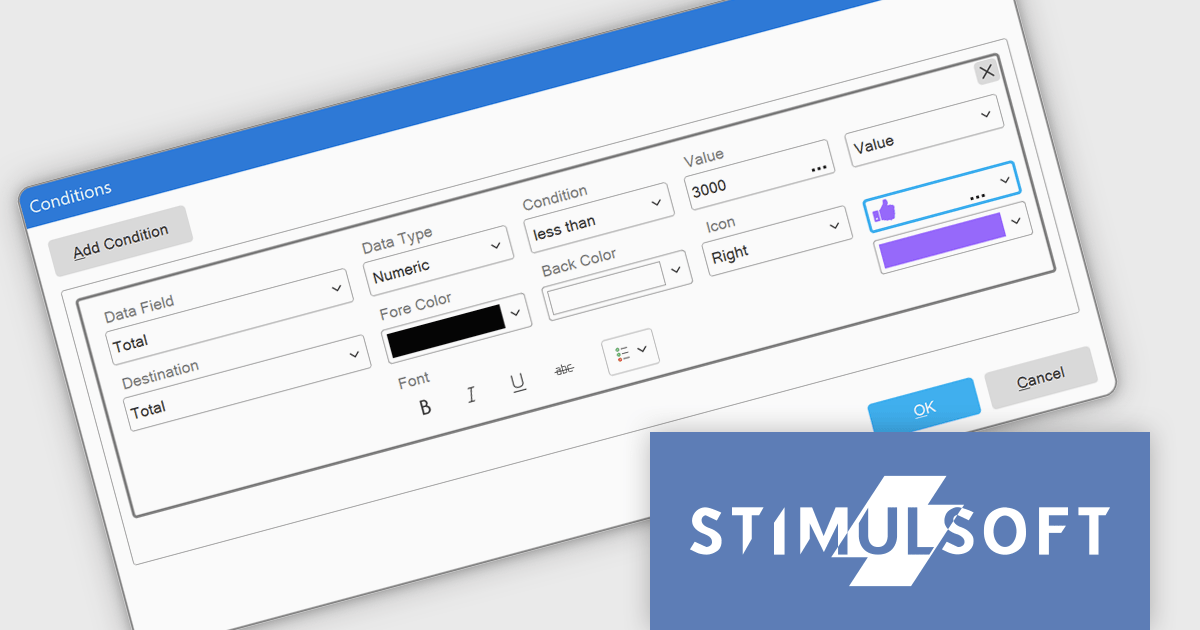
Stimulsoft Dashboards.WEB is a versatile suite of tools for crafting interactive data visualizations for web and desktop applications. It empowers developers to embed intuitive dashboards across various platforms, using the platform-specific components or a centralized cloud designer. With rich data analysis elements, extensive customization options, and pre-built templates, Stimulsoft Dashboards helps you transform complex data into clear, actionable insights for any audience.
The Stimulsoft Dashboards.WEB 2025.1.1 update introduces the ability to apply visual indicators in conditional formatting for table elements, providing users with a powerful tool to enhance data visualization. This feature allows icons or custom uploaded images to be dynamically applied to table cells based on predefined conditions, enabling more precise and intuitive representation of data. By integrating this functionality, developers can create dashboards that effectively highlight critical information, improve data readability, and deliver a more engaging user experience, all while maintaining flexibility for customization and alignment with specific project needs.
To see a full list of what's new in 2025.1.1, see our release notes.
Stimulsoft Dashboards.WEB is licensed per developer and is available as a perpetual license with 1 year support and maintenance. See our Stimulsoft Dashboards.WEB licensing page for full details.
Stimulsoft Dashboards.WEB is available individually or as part of Stimulsoft Ultimate.
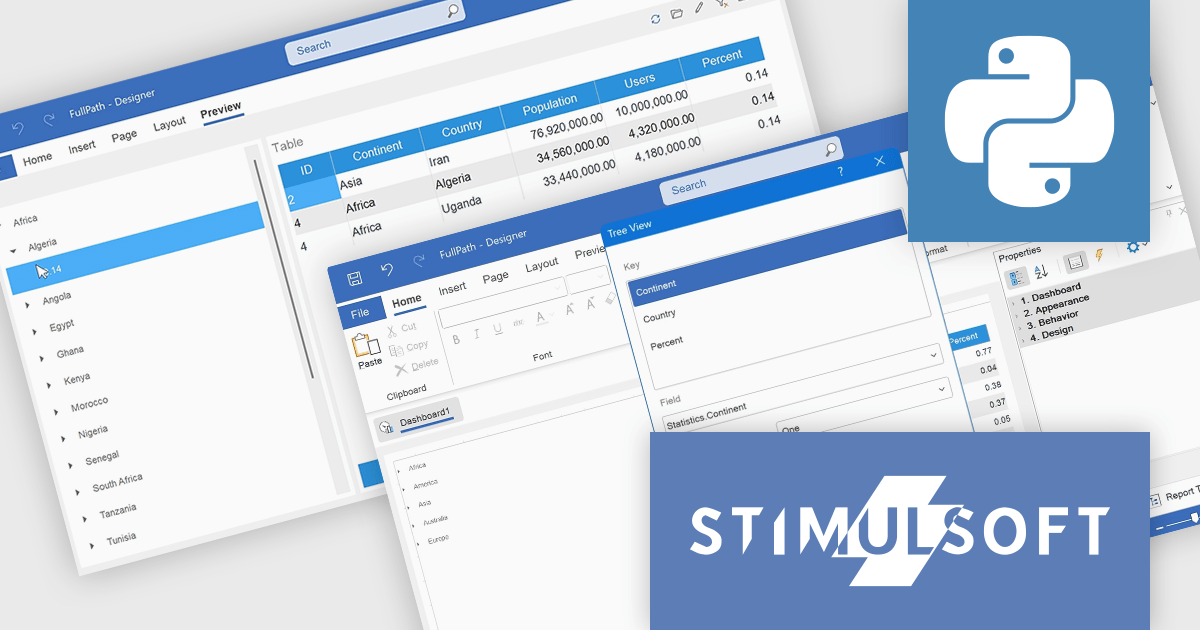
Stimulsoft Dashboards.PYTHON is a new data visualization tool specifically designed for building interactive dashboards within Python applications. It combines a client-side JavaScript engine for data processing with a designer component to craft dashboards and a viewer for displaying them. This empowers developers to create clear and informative visual representations of data directly within their Python projects.
The Stimulsoft Dashboards.PYTHON 2025.1.1 update introduces a new Filter Mode for tree elements, including Tree View and Tree View Box, providing users with greater control over how data is filtered within dashboards. This feature enables filtering based on a selected value alone or in combination with its hierarchical structure, offering flexibility in presenting and analyzing data. Designed to work when the Selection Mode is set to "One," the Filter Mode enhances precision and adaptability, making it easier to tailor dashboard behavior to specific use cases and improve the overall user experience.
To see a full list of what's new in 2025.1.1, see our release notes.
Stimulsoft Dashboards.PYTHON is licensed per developer and is available as a perpetual license with 1 year support and maintenance. See our Stimulsoft Dashboards.PYTHON licensing page for full details.
Stimulsoft Dashboards.PYTHON is available individually or as part of Stimulsoft Ultimate.
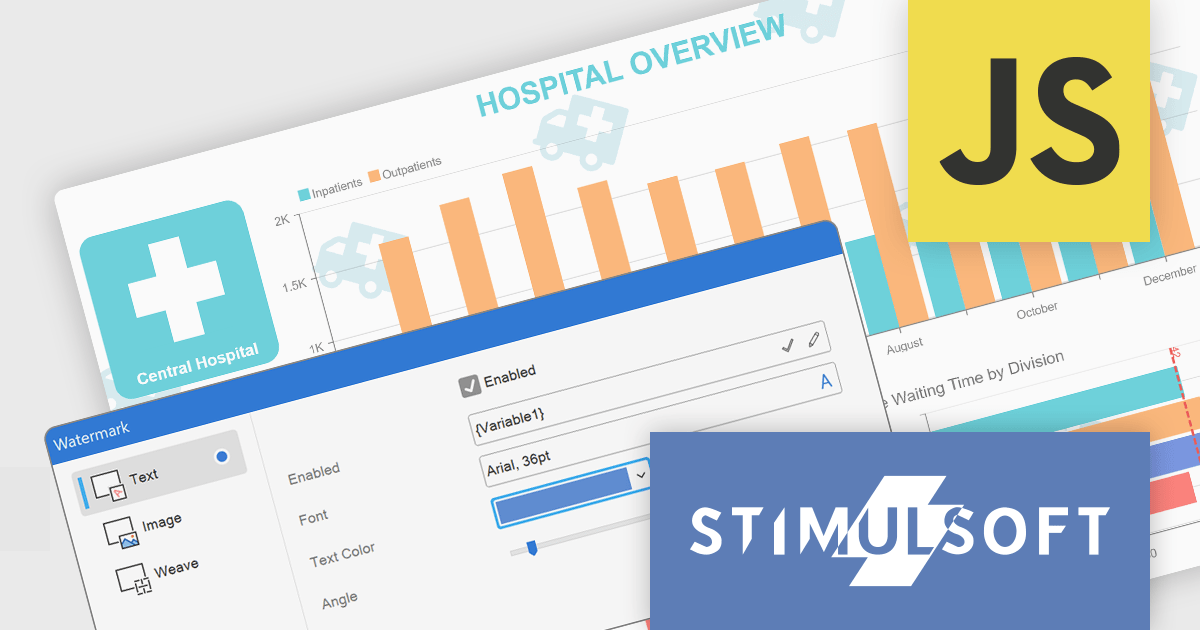
Stimulsoft Dashboards.JS is a JavaScript-based tool for creating interactive dashboards within web applications. Designed for developers and businesses, it provides customizable charts, graphs, and tables to visualize complex data from various sources. It supports popular JavaScript frameworks such as React, Vue.js, and Node.js, enabling seamless integration into modern web projects. With an intuitive interface and responsive design, it suits use cases like business intelligence, performance monitoring, and data-driven decision-making. Stimulsoft Dashboards.JS enhances user engagement and simplifies data analysis for industries such as finance, marketing, and logistics.
The Stimulsoft Dashboards.JS 2025.1.1 update introduces the ability to use expressions in dashboard watermarks, providing developers with enhanced flexibility to create dynamic and context-aware visual elements. This feature allows watermarks to adapt based on data or user-defined expressions, enabling the seamless integration of real-time information, branding, or contextual details directly into dashboards. By supporting Text, Image, Weave, and combined elements, the update streamlines customization and ensures that watermarks can align with specific design or functional requirements, helping developers deliver more polished and responsive dashboards.
To see a full list of what's new in 2025.1.1, see our release notes.
Stimulsoft Dashboards.JS is licensed per developer and is available as a Perpetual license with 1 year support and maintenance. See our Stimulsoft Dashboards.JS licensing page for full details.
Stimulsoft Dashboards.JS is available individually or as part of Stimulsoft Ultimate.
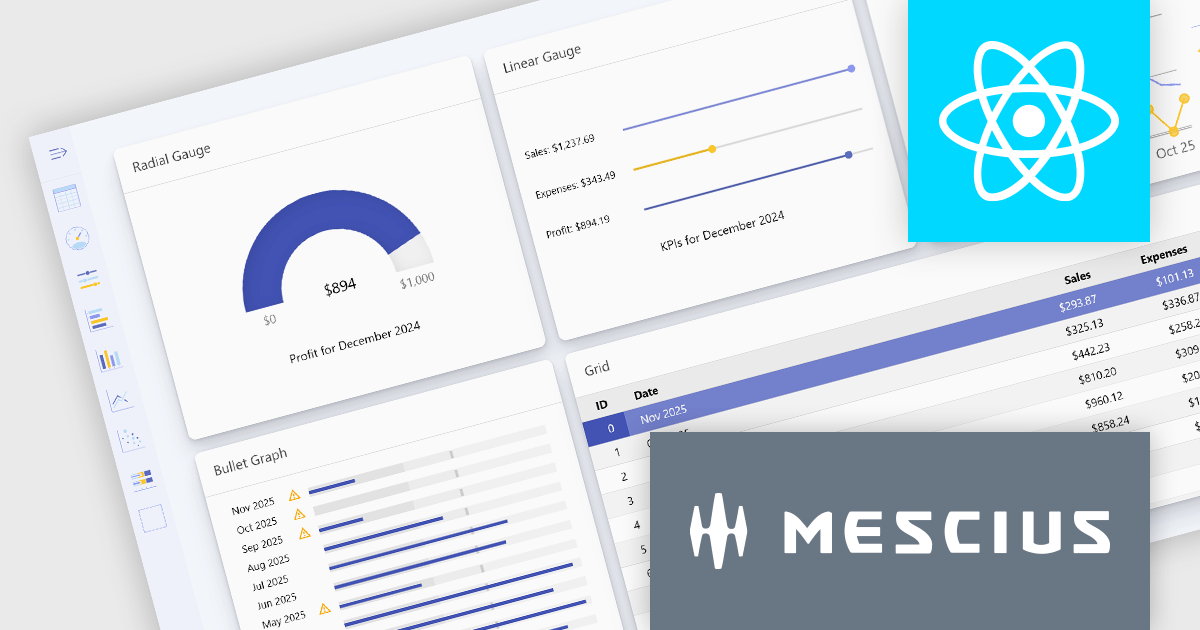
Wijmo is a complete collection of extensible, fast, flexible JavaScript UI components written in TypeScript. The framework-agnostic Wijmo components include first-class support for top frameworks including Angular, React, Vue and Web Components. Wijmo Enterprise has over 100 dynamic UI components to help cut your development time in half, allowing you to build lightweight, high-performance JavaScript applications using your favorite JavaScript framework.
Wijmo's dynamic dashboard sample allows users to create customizable, interactive dashboards, similar to those seen in Google Analytics. The new version of the dashboard, now built with React, offers a range of key features including touch-screen support, drag-and-drop functionality, and pre-defined tile types, making it an ideal solution for users looking to create personalized, data-rich visualizations.
In this blog post, MESCIUS Product Marketing Specialist Grant Katanick takes you through the steps for creating a dynamic dashboard for your JavaScript web applications. Key features of the React-based dashboard include:
Detailed sample source code is included that you can use as a starting point for your actual dashboard applications.
Read the complete blog to get started building dynamic dashboards with React and Wijmo.
Wijmo is licensed per developer. Developer licenses are perpetual and include 1 year subscription which provides upgrades, including bug fixes and new features. See our Wijmo licensing page for full details.
For more information, visit our Wijmo product page.

Charts in a dashboard component transform raw data into clear, actionable visuals, making it easy to monitor trends, track performance, and spot critical insights in real time. These interactive tools support various use cases, from sales forecasting and KPI tracking to project progress monitoring and customer behavior analysis. By offering a centralized, intuitive view of essential metrics, charts help teams make faster, data-driven decisions, optimize operational efficiency, and respond proactively to emerging opportunities or issues.
Several JavaScript products offer chart components with dashboard support including:
Explore our range of JavaScript dashboard components.
Need help to find the right software license, upgrade or renewal? Call, Email, or Live Chat with our experts.
联系电话: (888) 850 9911
传真: +1 770 250 6199


