


官方供应商
我们作为官方授权经销商,直接提供超过200家开发厂家所发行超过1000个的产品授权给您。
查看我们的所有品牌。
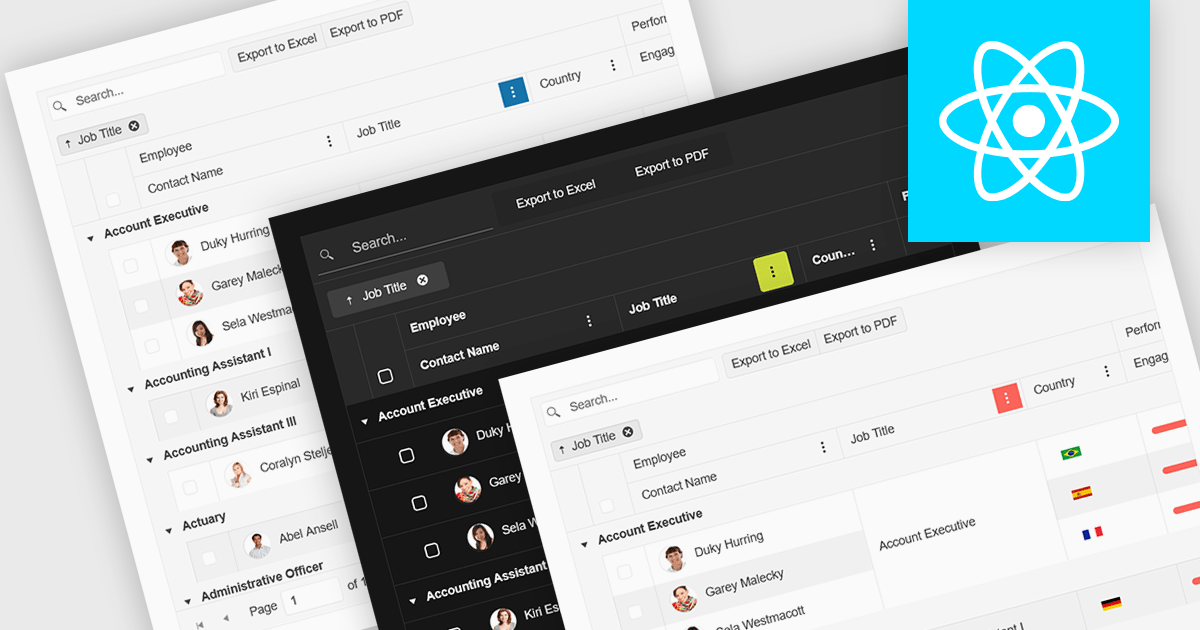
Built-in theme support in a React grid refers to the component's ability to natively integrate and adapt to predefined visual styles without requiring extensive custom CSS. This feature allows developers to quickly apply consistent, professional-looking designs that align with widely used UI frameworks such as Material UI, Bootstrap, or custom enterprise branding. It simplifies the process of maintaining visual consistency across applications, reduces front-end development time, and ensures that the grid remains visually coherent with the rest of the user interface, particularly during updates or when switching between themes.
Several React Grid controls offer support for built-in themes including:
For an in-depth analysis of features and price, visit our comparison of React Grid controls.
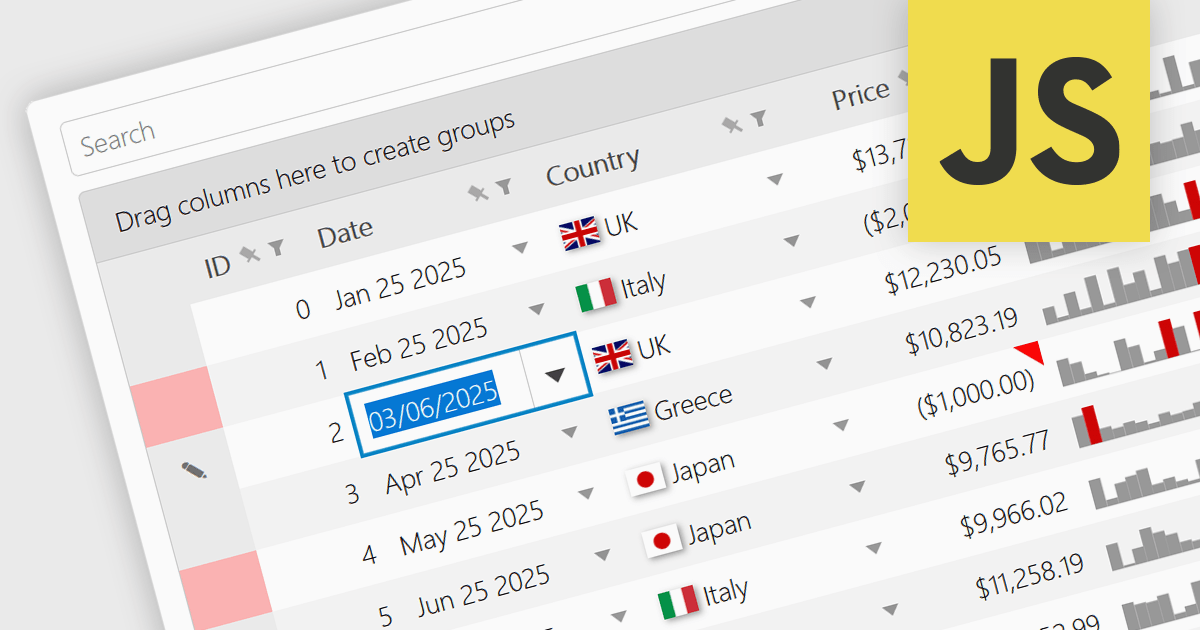
A date/time cell type in a JavaScript Grid control lets developers manage temporal data more effectively by treating input as actual JavaScript Date objects rather than plain text. This enables built-in features like calendar popups, time pickers, and structured output formats such as "09/09/2025" or "Sep 9 2025", making it easier for users to interact with the data accurately. It's especially useful in applications that rely on scheduling, activity logs, or time-driven reports. Most modern grid libraries also support localization, formatting, and input validation to ensure the cell behavior fits seamlessly with the application's design and data standards.
Several JavaScript Grid controls offer support for Date/Time cell types including:
For an in-depth analysis of features and price, visit our comparison of JavaScript Grid controls.
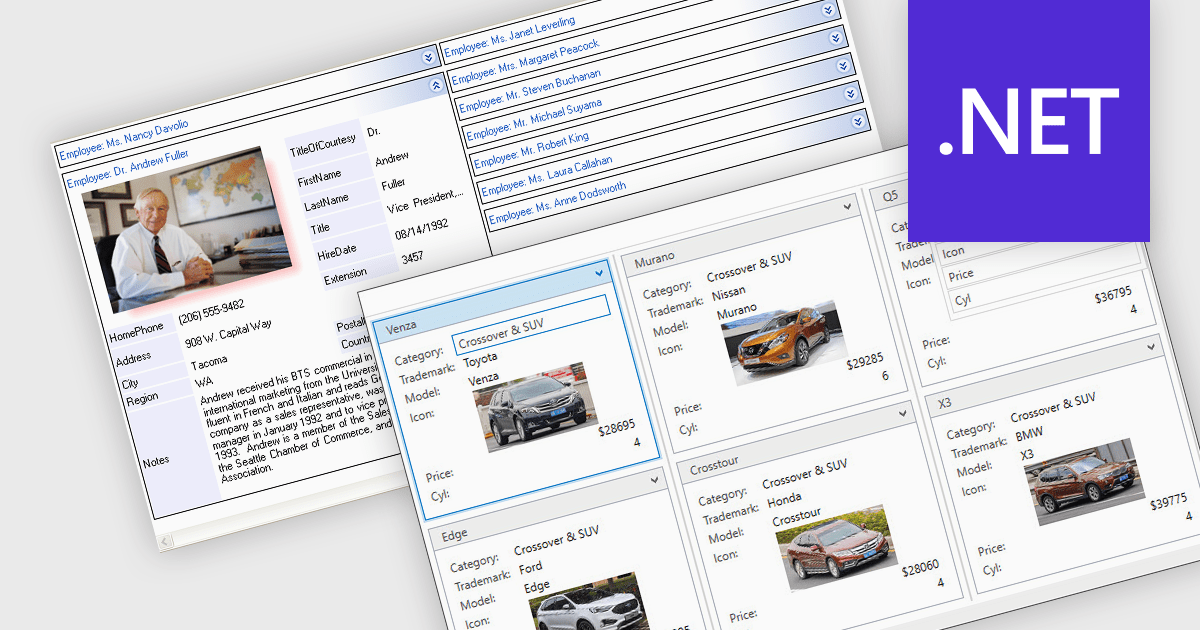
Card view is a grid layout option that displays data as a series of individual cards arranged in rows and columns, rather than as traditional table rows. Each card encapsulates related fields, often with custom formatting and embedded controls, allowing for more visual and flexible presentation of complex data. This format is especially beneficial in scenarios where users need to review, interact with, or compare structured records involving rich content or media in a more engaging and user-friendly layout.
Several .NET grid components allow you to use card view, including:
For an in-depth analysis of features and price, visit our comparison of .NET grid components.
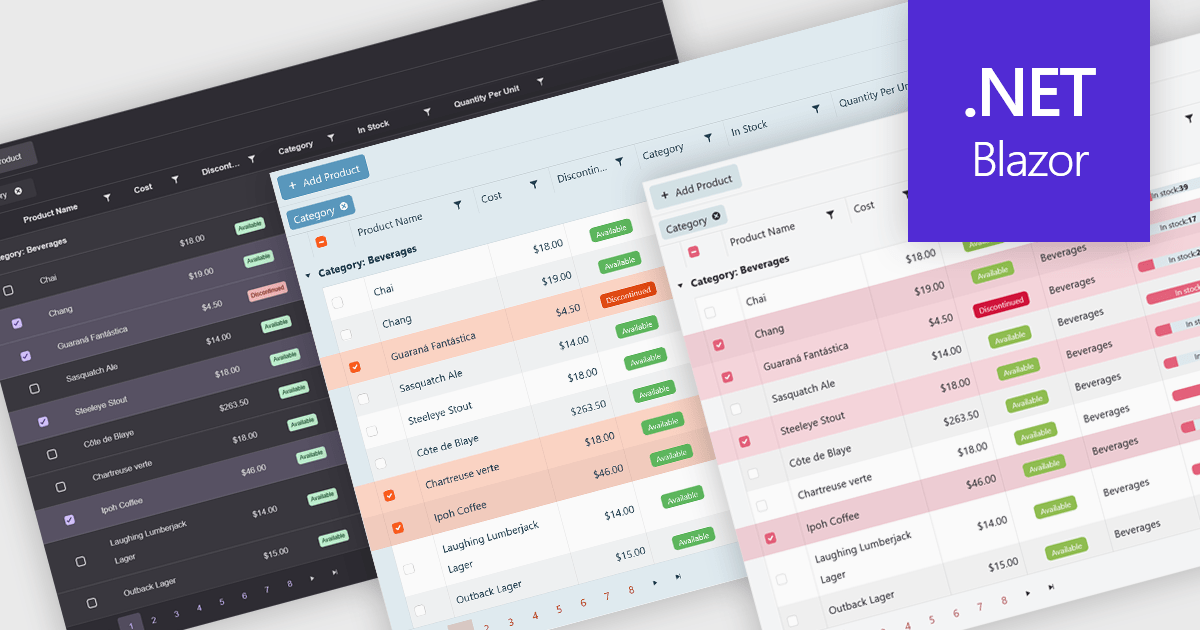
Built-in themes for grids are pre-designed visual styles that can be applied directly to data grid components within applications. These themes define elements such as color schemes, typography, spacing, and borders to create a consistent and polished appearance without requiring manual CSS. The primary benefit is efficiency, as teams can quickly implement a cohesive look that aligns with modern user interface standards. Built-in themes also enhance usability by improving readability, supporting accessibility, and offering a familiar interface that reduces user effort. For example, enterprise dashboards, admin panels, and financial reporting tools can all benefit from built-in themes to present complex data in a clear, user-friendly format while maintaining visual consistency across different parts of the application.
Several .NET Blazor grid components offer built-in theme support including:
For an in-depth analysis of features and price, visit our .NET Blazor grid controls comparison.
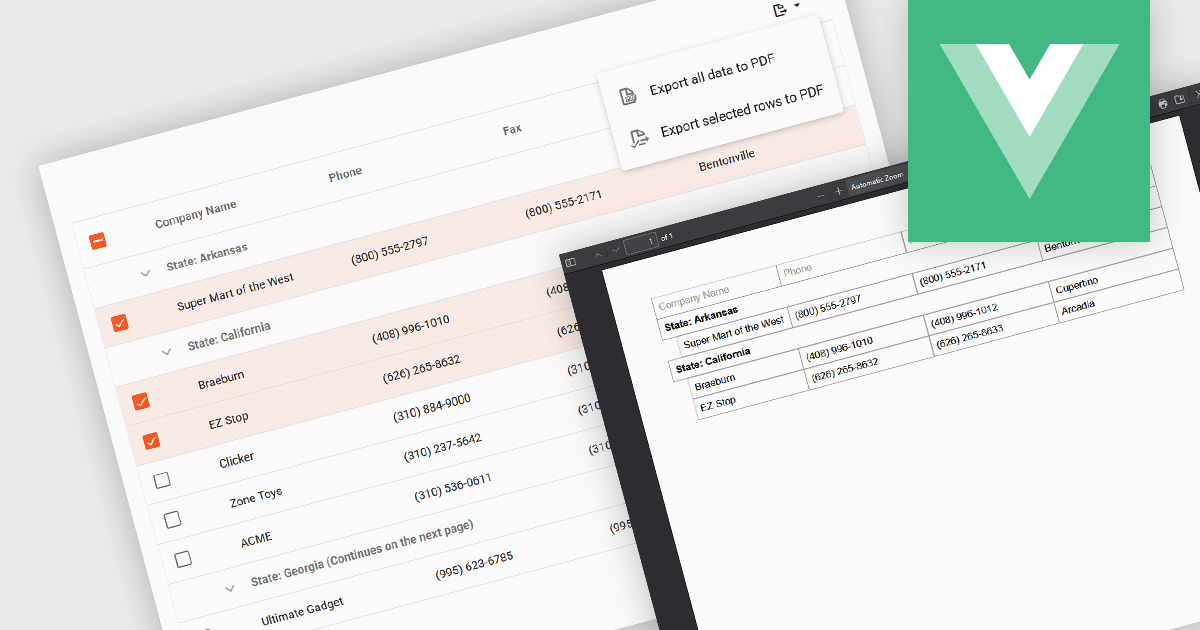
Export selection in a data grid is the ability to export only a defined range, the specific rows, columns or cells that a user has actively selected, rather than the entire dataset. This selective approach is particularly valuable when working with large data sets, as it allows users to extract and share only the most relevant subset of information without additional filtering or manual deletion after export. By reducing the volume of unnecessary data in exported files, it improves efficiency, helps maintain focus on the intended content, and can enhance security by avoiding the inclusion of sensitive or unrelated information. This targeted export capability is commonly used to output data in formats such as CSV, Excel, or PDF, supporting the integration of grid data into reporting and analysis processes.
Several Vue.js grid components allow you to export selections, including:
For an in-depth analysis of features and price, visit our comparison of Vue.js grid components.
联系电话: (888) 850 9911
传真: +1 770 250 6199


