


官方供应商
我们作为官方授权经销商,直接提供超过200家开发厂家所发行超过1000个的产品授权给您。
查看我们的所有品牌。
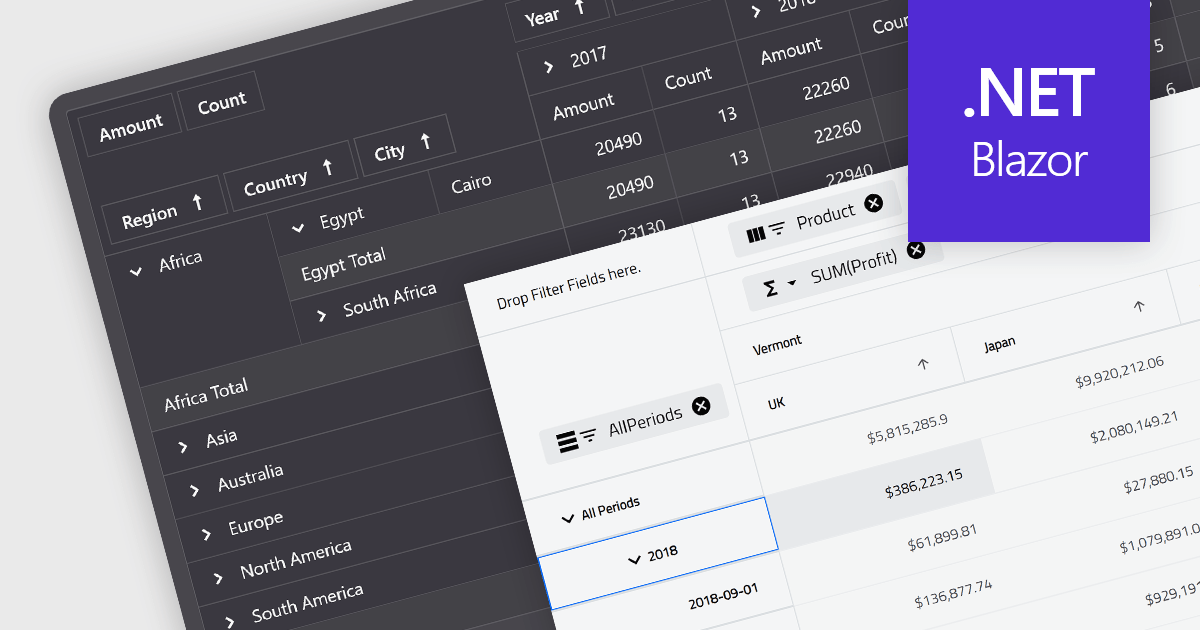
A pivot grid is a powerful data analysis tool that allows you to dynamically summarize and reorganize large datasets. By dragging and dropping fields, you can quickly create a new table that groups and calculates values based on different categories, revealing trends and patterns within your data. This interactive functionality makes pivot grids ideal for gaining insights and informing data-driven decisions. Common use cases include financial analysis, marketing campaign evaluation, and sales performance exploration.
Several Blazor UI suites feature a pivot grid control including:
For an in-depth analysis of features and price, visit our Blazor UI suites comparison.
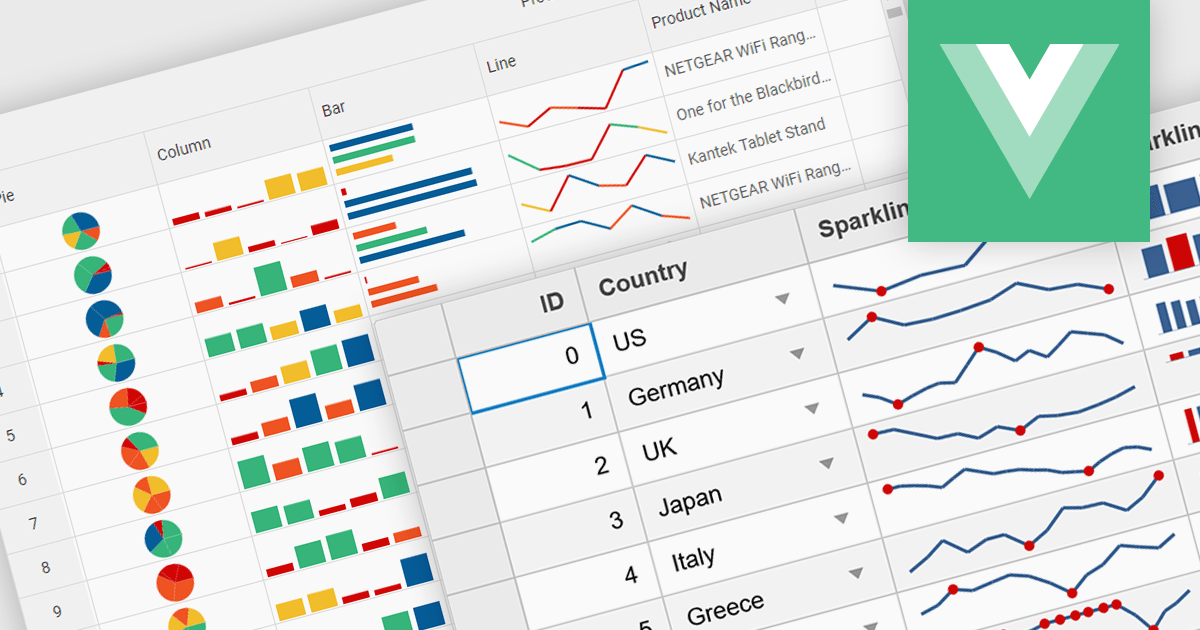
Sparklines are miniature charts embedded directly within grid cells, providing a quick visual summary of data trends within a larger dataset. These tiny line graphs, often lacking axes or detailed labels, condense information into a highly space-efficient format, allowing viewers to grasp patterns and fluctuations at a glance across multiple rows and columns of a grid.
Several Vue.js grid controls offer support for sparklines including:
For an in-depth analysis of features and price, visit our Vue.js Grid controls comparison.
ComponentOne Studio WinForms is a comprehensive development toolkit that empowers you to build feature-rich Windows Forms applications with ease. It equips you with over 120 UI controls spanning data presentation, input elements, and application layout. ComponentOne boasts extensive customization options, seamless Visual Studio integration, and support for the latest .NET versions, making it a valuable asset for streamlining WinForms development.
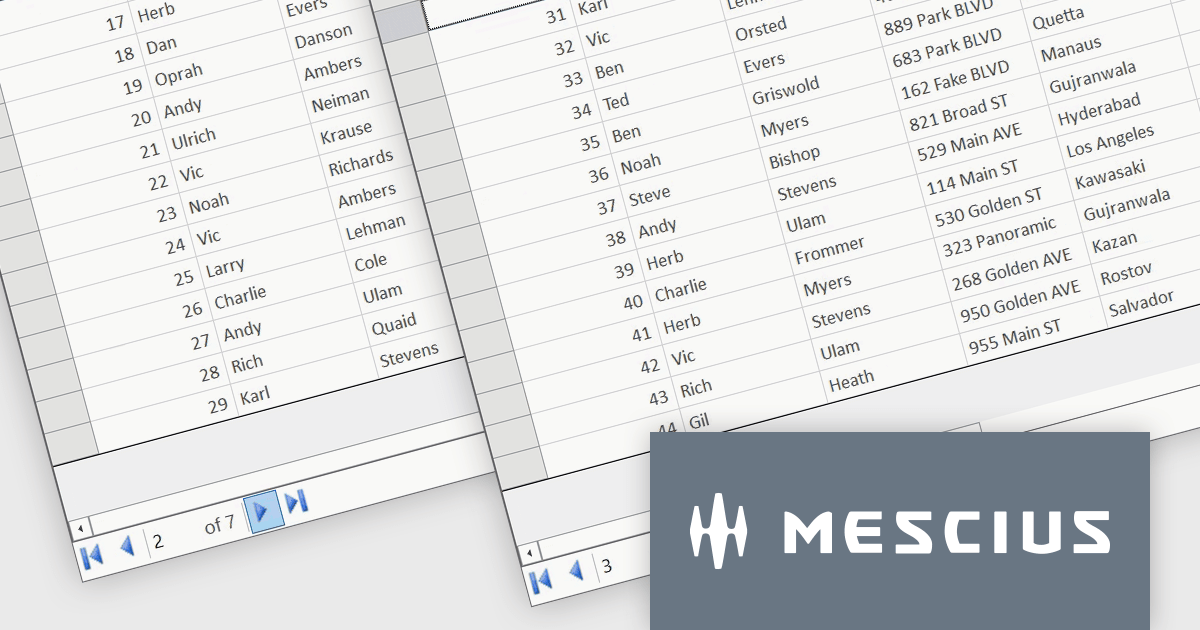
In this blog post, MESCIUS Software Engineer Kartik Dua demonstrates how paging can be implemented in the FlexGrid Datagrid control to provide an intuitive way to interact with large sets of data. Steps include:
A demo project to implement the paging functionality is available for download, as well.
Read the full blog to get started working with large datasets quickly and efficiently.
ComponentOne Studio WinForms is licensed per Developer on a perpetual basis and includes a 12 month subscription. Priority Support is also available. See our ComponentOne Studio WinForms licensing page for full details.
ComponentOne FlexGrid for WinForms is available to buy in the following products:
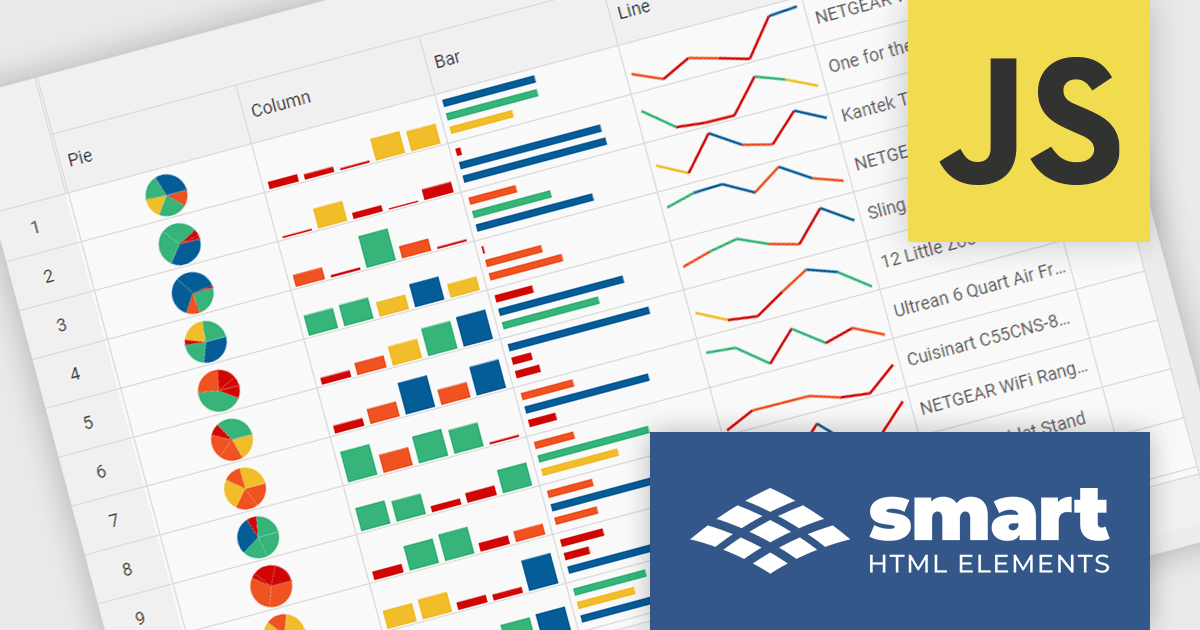
Smart HTML Elements is an enterprise-grade UI library offering pre-built web components for developers in Angular, React, Vue, Blazor, and JavaScript. It boasts over 60 ready-to-use components like grids, charts, schedulers, and editors, all featuring two-way data binding, responsiveness, accessibility, and theming capabilities. This library helps developers rapidly build dynamic and modern web applications with consistent look-and-feel and rich functionalities, accelerating development time and ensuring professional quality.
The Smart HTML Elements v19.0.0 release adds support for Grid Sparklines. These are small, data-intense, design simple charts that fit into a single cell of a grid and provide a visual representation of data trends. They are typically used to show trends in a series of values, such as seasonal increases or decreases, economic cycles, or to highlight maximum and minimum values. Grid Sparklines help users to quickly understand patterns and trends in their data without having to create separate charts or graphs.
To see a full list of what's new in v19.0.0, see our release notes.
Smart HTML Elements is licensed per developer and is available as a Perpetual license with 1 year support and maintenance. It includes distribution to Unlimited Web applications, SaaS projects, Intranets and Websites. See our Smart HTML Elements licensing page for full details.
Learn more on our Smart HTML Elements product page.
CSV export in grid components refers to the functionality that allows users to download data as a Comma-Separated Values (CSV) file. Exporting data to CSV format offers significant benefits, including compatibility with a wide range of applications, such as Microsoft Excel, Google Sheets, and other data analysis tools, facilitating easy sharing and processing. Use cases for CSV export are diverse, ranging from business analysts exporting reports for further analysis, to IT professionals extracting system data for audit and compliance purposes. Developers can leverage CSV export to provide users with a straightforward method to back up or transfer data between different systems or platforms, enhancing the utility and flexibility of applications that handle large datasets.
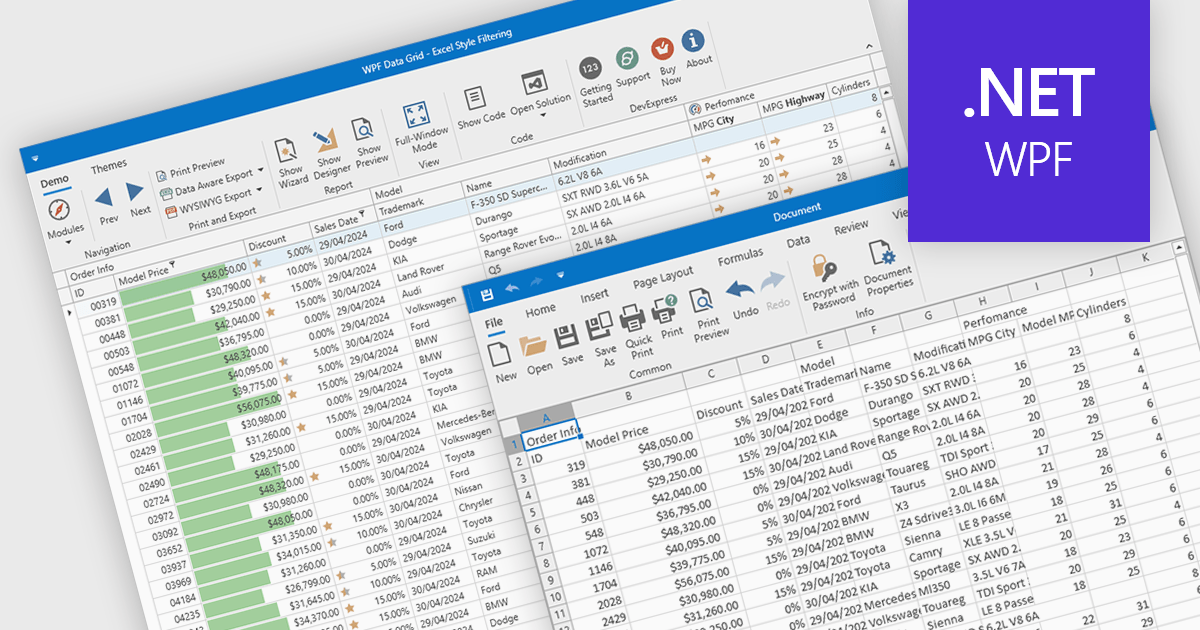
Several WPF grid controls offer export to CSV including:
For an in-depth analysis of features and price, visit our WPF Grid controls comparison.
联系电话: (888) 850 9911
传真: +1 770 250 6199


