


官方供应商
我们作为官方授权经销商,直接提供超过200家开发厂家所发行超过1000个的产品授权给您。
查看我们的所有品牌。
Stimulsoft Reports.WEB is a cross-platform reporting solution designed for integration within web applications. It leverages a client-server architecture for report generation, viewing, printing, and exporting directly in web browsers. Its powerful .NET report engine offers efficient report processing, a user-friendly HTML5 report designer for building reports with various data sources and visualizations, and an interactive HTML5 viewer for seamless report display within web applications. This integration allows developers to implement robust reporting functionalities without browser plugins or additional client-side dependencies.
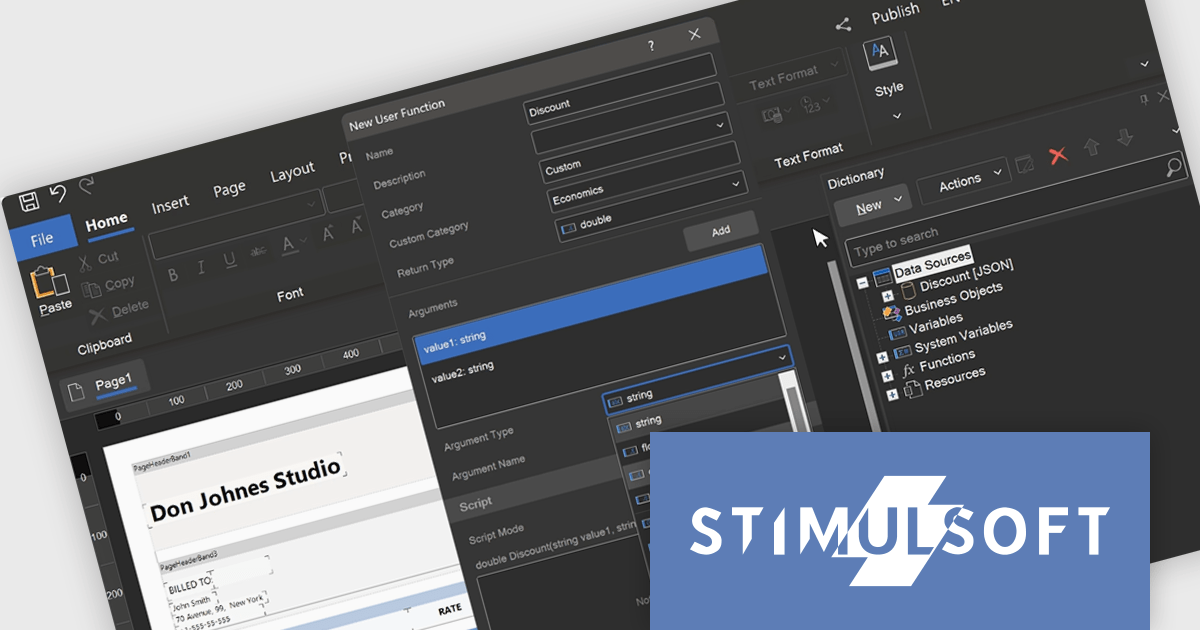
The Stimulsoft Reports.WEB 2024.3 release empowers developers with user-defined functions within the data dictionary. This functionality extends report capabilities by allowing creation of custom logic using either the visual programming tool Blockly or directly in supported scripting languages. These user-defined functions can be seamlessly integrated into reports enabling developers to address complex calculations, data transformations, or custom formatting logic without code modifications in the main application. This streamlines development, promotes code reusability, and fosters a more dynamic reporting environment.
To see a full list of what's new in version 2024.3, see our release notes.
Stimulsoft Reports.WEB is licensed per developer and is available as a Perpetual license with 1 year support and maintenance. See our Stimulsoft Reports.WEB licensing page for full details.
Stimulsoft Reports.WEB is available in the following products:
ActiveReports.NET from MESCIUS (formerly GrapeCity) is a comprehensive reporting solution for developers building applications in the .NET framework. It empowers you to design and deliver visually appealing reports through user-friendly designers and a wide range of controls. ActiveReports simplifies report creation and distribution with a versatile API, rich data source connectivity, and support for multiple export formats. This translates to increased developer productivity and improved end-user experience with powerful reporting functionalities within your .NET applications.
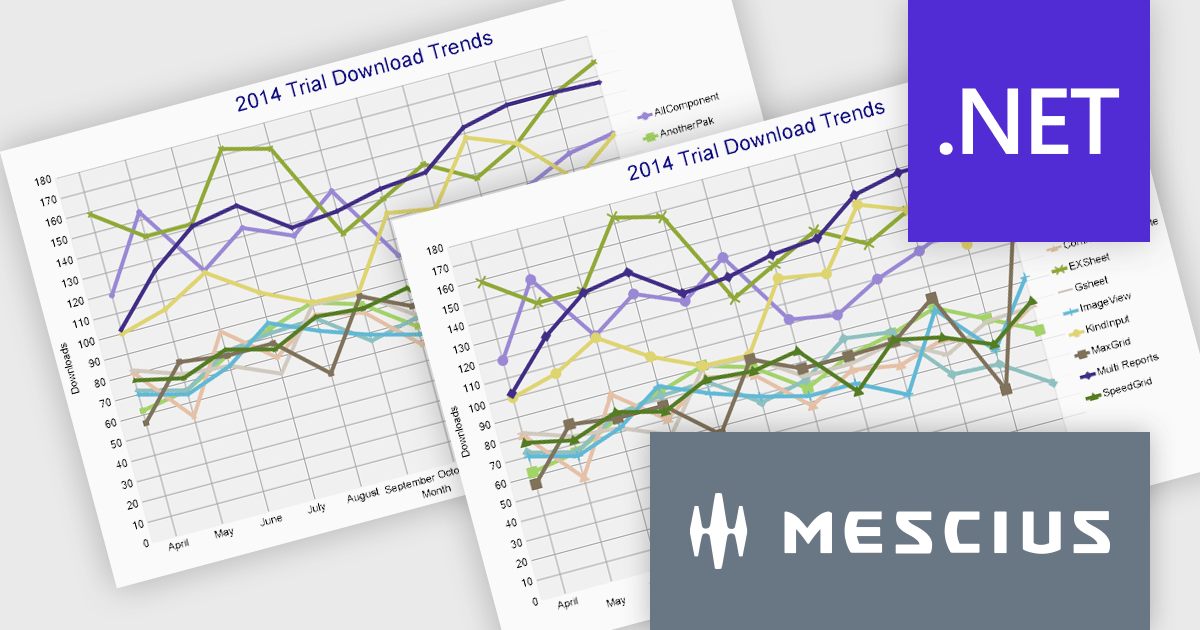
The ActiveReports.NET 18.1 update adds additional attributes to improve the customization and visual representation of charts in RDLX, Page, and Dashboard reports. The new LabelRowCount property, applies to the X-axis of charts and allows you to choose the number of rows for axis labels, enabling multi-row layouts for improved label display and organization. The new SymbolSize property allows you to change the size of plot symbols, giving you more control over chart data presentation. It is compatible with the following chart types: Line chart, Radar line chart, Radar scatter chart, Radar bubble chart, Scatter chart, and Bubble chart. These modifications are intended to improve the clarity and adaptability of chart displays within your .NET Report applications.
To see a full list of what's new in 18.1, see our release notes.
ActiveReports.NET is licensed per developer and is available with or without a 12 month support and maintenance subscription. See our ActiveReports.NET licensing page for full details.
Learn more on our ActiveReports.NET product page.
Stimulsoft Reports.PYTHON provides a collection of tools for creating, viewing, exporting, and printing reports within your Python applications. It allows you to connect to various data sources and leverage client-server technology for efficient report generation. Additionally, Stimulsoft offers powerful features for visualizing and analyzing your data.
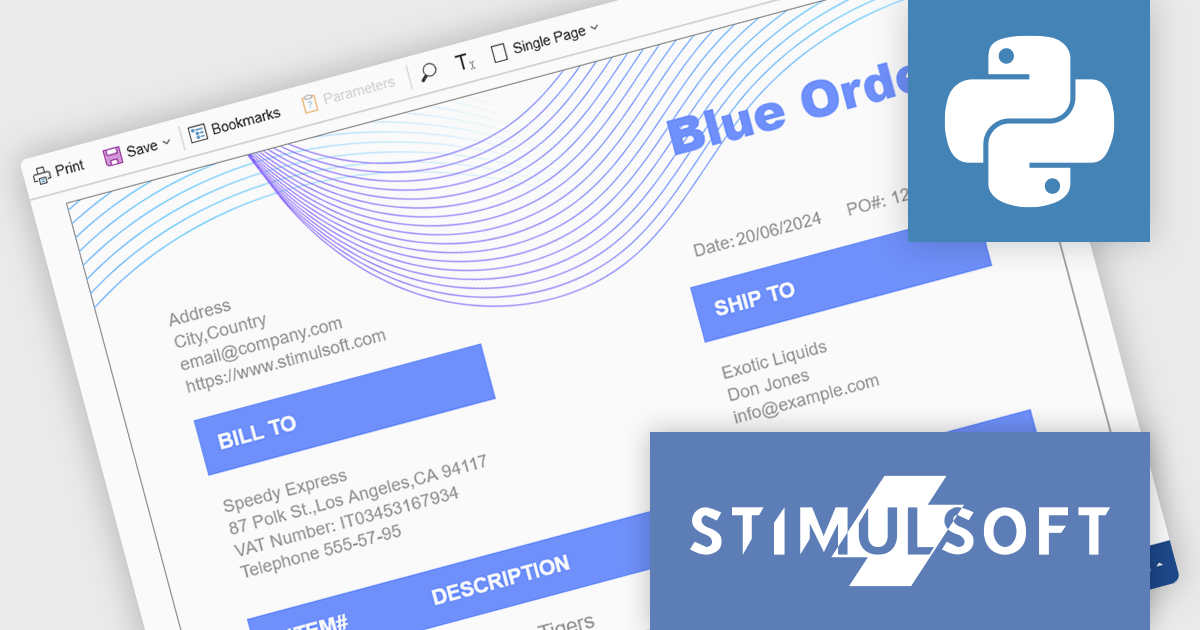
The Stimulsoft Reports.PYTHON 2024.3 release enables developers to generate and export reports entirely on the Python server, offering greater control and flexibility. All existing reporting tool events and Python data adapters remain fully functional within this server-side environment. Server-side rendering unlocks several advantages, reducing client-side load, improving report generation speed, and enhancing security by keeping sensitive data on the server. It caters to scenarios where complex reports or data privacy concerns necessitate a server-centric approach.
To see a full list of what's new in version 2024.3, see our release notes.
Stimulsoft Reports.PYTHON is licensed per developer and is available as a Perpetual license with 1 year support and maintenance. See our Stimulsoft Reports.PYTHON licensing page for full details.
Stimulsoft Reports.PYTHON is available in the following products:
Stimulsoft Reports.PHP is a reporting tool designed to be embedded within PHP applications. It offers a client-server architecture for generating, viewing, printing, and exporting reports online. The solution includes a JavaScript report engine for fast execution, a native JavaScript report designer for building reports with various data sources and visualizations, and a PHP server-side component for data processing. This integration allows developers to seamlessly add robust reporting functionality to their PHP applications.
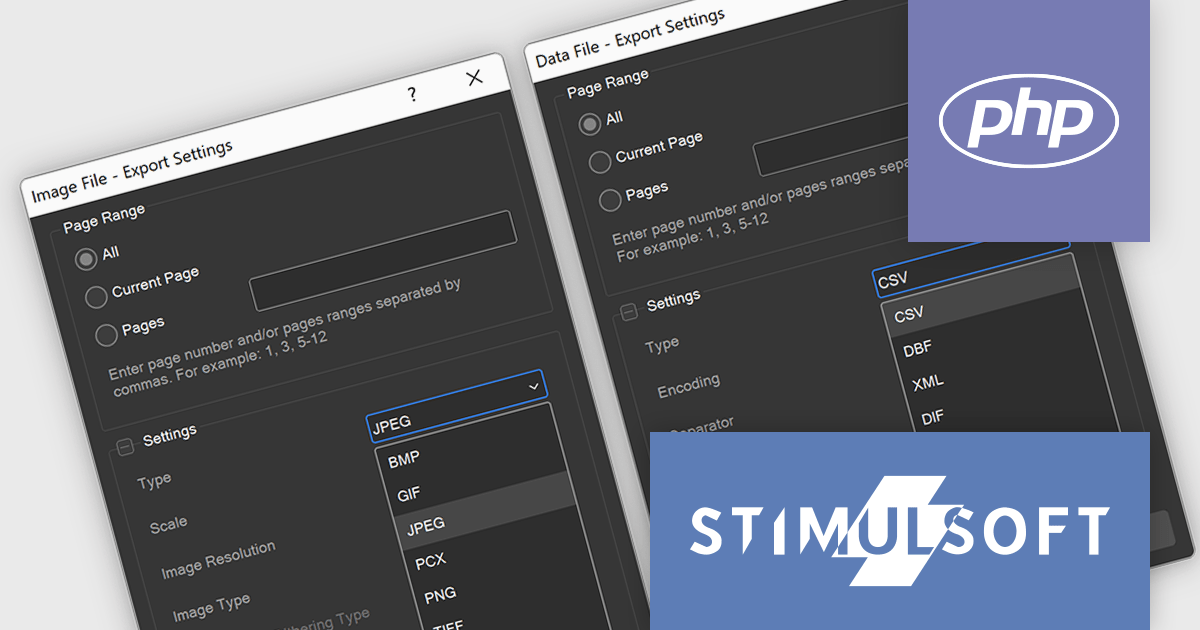
The Stimulsoft Reports.PHP 2024.3 update significantly expands report output options. Reports can now be exported to various data-oriented formats including CSV, JSON, XML, and legacy options like DBF, DIF, and SYLK. This allows for seamless data exchange and integration with other applications. Furthermore, reports can be exported as a wide range of image formats like BMP, GIF, JPEG, and PNG, providing flexibility for visual representation. This expanded functionality caters to diverse needs, simplifying data exchange, visual presentation, and document sharing.
To see a full list of what's new in version 2024.3, see our release notes.
Stimulsoft Reports.PHP is licensed per developer and is available as a Perpetual license with 1 year support and maintenance. See our Stimulsoft Reports.PHP licensing page for full details.
Stimulsoft Reports.PHP is available in the following products:
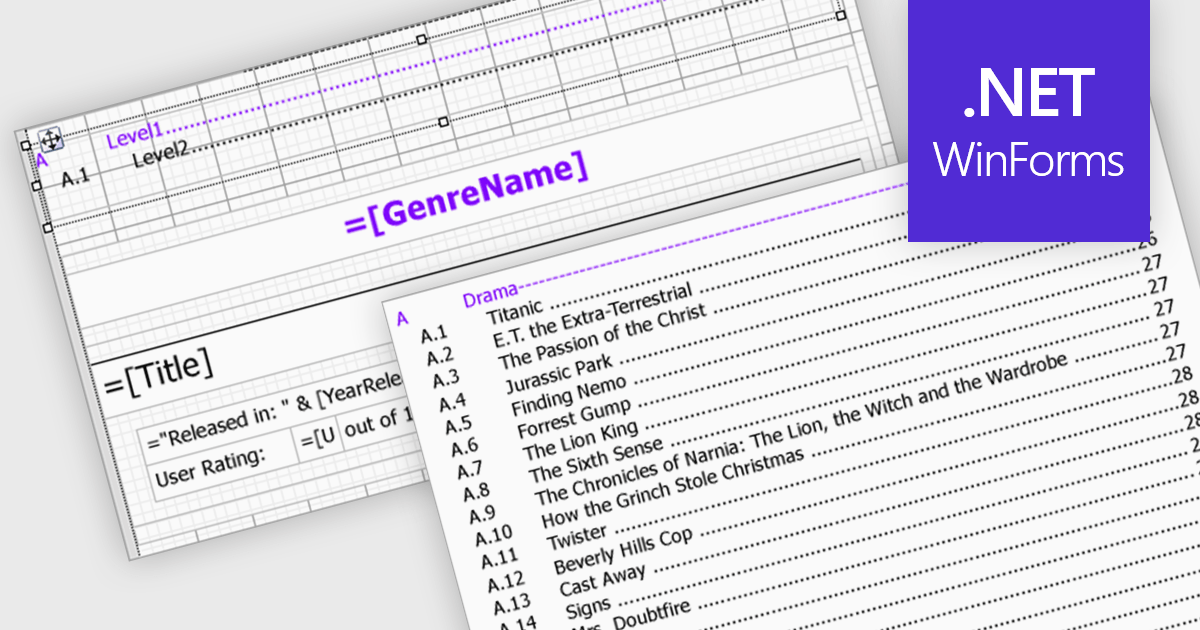
Reporting components streamline document creation by offering automatic Table of Contents (TOC) generation. This feature scans a document for designated headings, like titles and subtitles, and builds a clickable index at the beginning. This not only enhances professionalism but also improves user experience by allowing for easy navigation within lengthy reports. Automatic TOC generation proves particularly valuable for complex documents, research papers, and technical manuals, where readers might need to quickly jump to specific sections.
Several WinForms reporting components support Table of Contents (TOC) features, including:
For an in-depth analysis of features and price, visit our comparison of WinForms reporting components.
联系电话: (888) 850 9911
传真: +1 770 250 6199


