













官方供应商
我们作为官方授权经销商,直接提供超过200家开发厂家所发行超过1000个的产品授权给您。
查看我们的所有品牌。
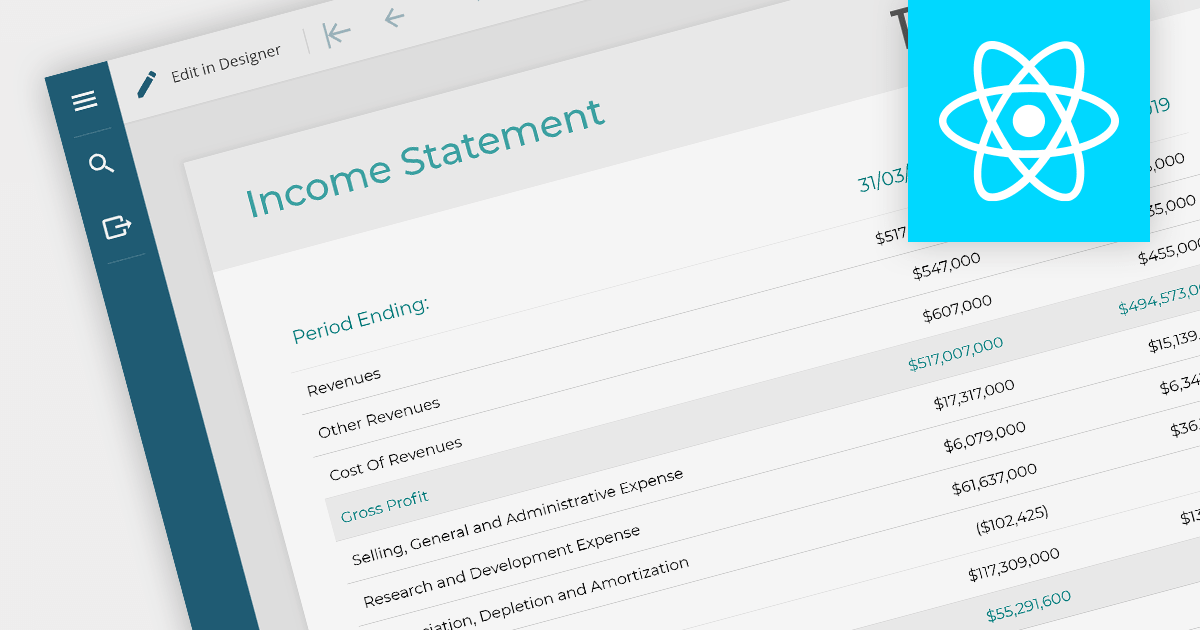
Report viewers for React let users view and interact with various types of reports on the Web. They make it easy to embed reports, display a variety of report types, and customize the look and feel of reports, as well as enabling interactions such as zooming, panning, and filtering. Report viewers let users explore and gain valuable insights from their data directly within the React environment.
Here is a selection of React reporting controls include report viewers:
For an in-depth analysis of features and price, visit our comparison of React reporting controls.
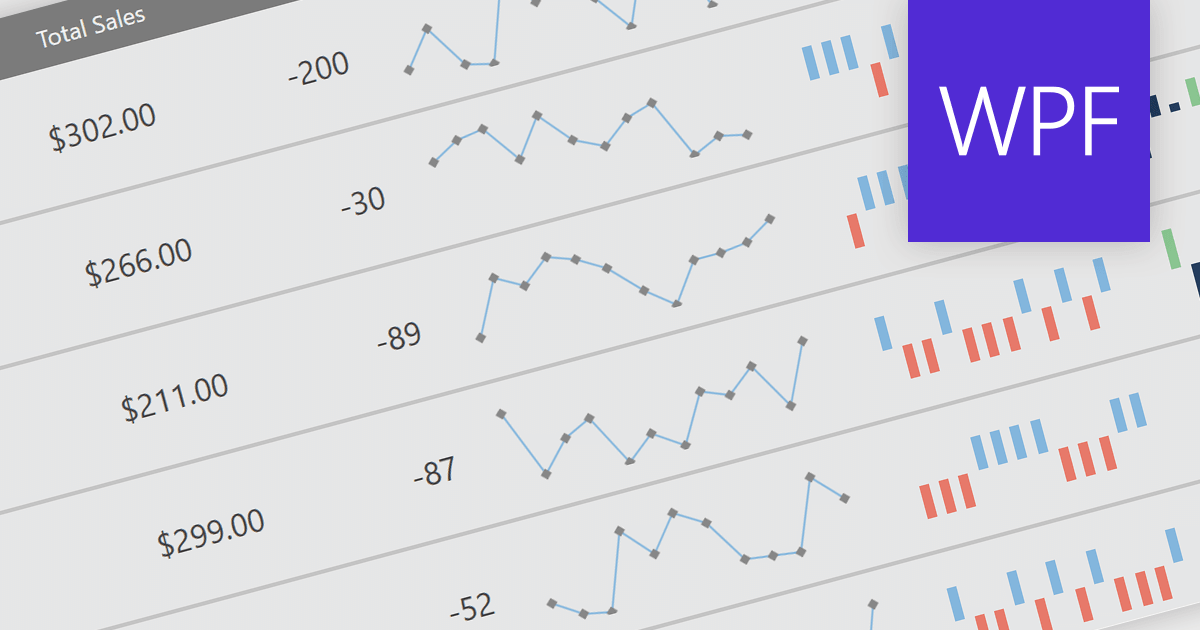
Sparklines are miniature line graphs designed to provide a visual representation of data trends within a compact space. They condense information into a single line or bar, often displayed alongside text or numbers. They allow for quick and intuitive understanding of patterns, making them useful for displaying data in tight spaces such as data tables, and providing visual summaries at a glance.
The following WPF reporting controls include support for sparklines:
For an in-depth analysis of features and price, visit our comparison of WPF reporting controls.
联系电话: (888) 850 9911
传真: +1 770 250 6199


