


官方供应商
我们作为官方授权经销商,直接提供超过200家开发厂家所发行超过1000个的产品授权给您。
查看我们的所有品牌。
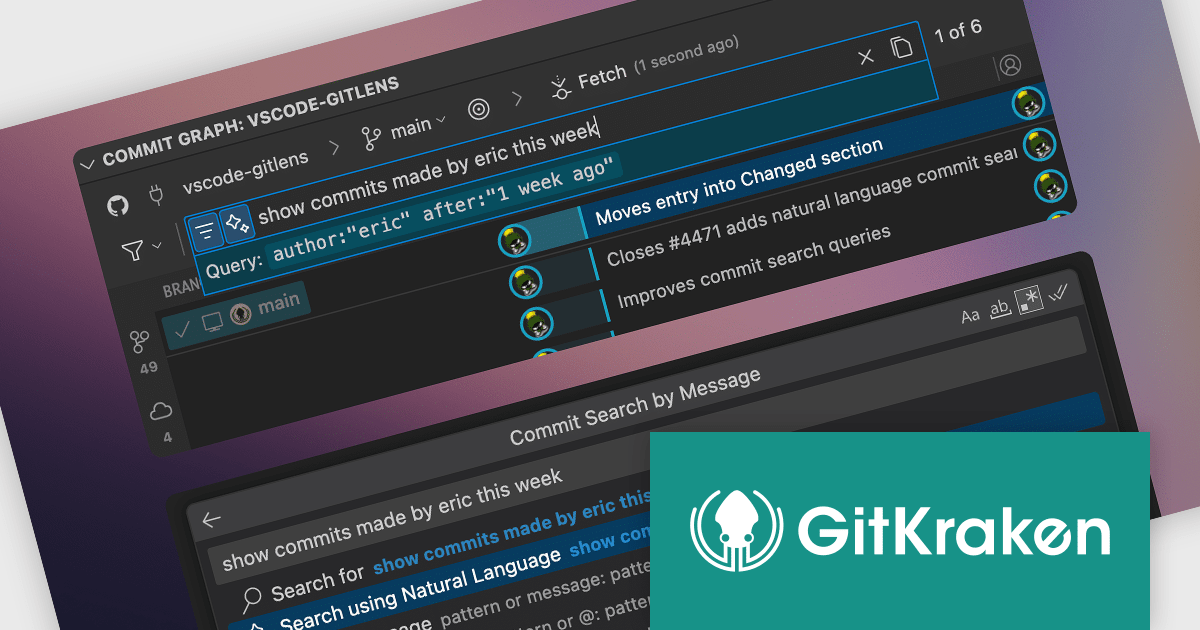
GitKraken is a suite of developer tools built around Git, a popular version control system. It offers a graphical user interface (GUI) that allows developers to interact with Git repositories visually instead of relying on the command line. This simplifies complex Git workflows like resolving merge conflicts and visualizing code history, making Git more accessible and efficient for developers of all experience levels.
The GitLens for VS Code V17.3 release (included in GitKraken) introduces natural language search for the Commit Graph and command palette, significantly improving how developers interact with their repository's history. Rather than relying on specific syntax or exact commit messages, users can now describe what they’re looking for in plain English and receive relevant results instantly. This change reduces friction in uncovering specific commits or actions, making version history more accessible and actionable. It's particularly valuable in large codebases where precise recall of commit details may be impractical, offering a faster, more intuitive path to insight.
To see a full list of what's new in V17.3, see our release notes.
GitLens for VS Code is part of GitKraken which is available as Cloud-based or On-Premise options, licensed per user as an annual license which includes free updates and technical support. See our GitKraken licensing page for full details.
Learn more on our GitKraken product page.
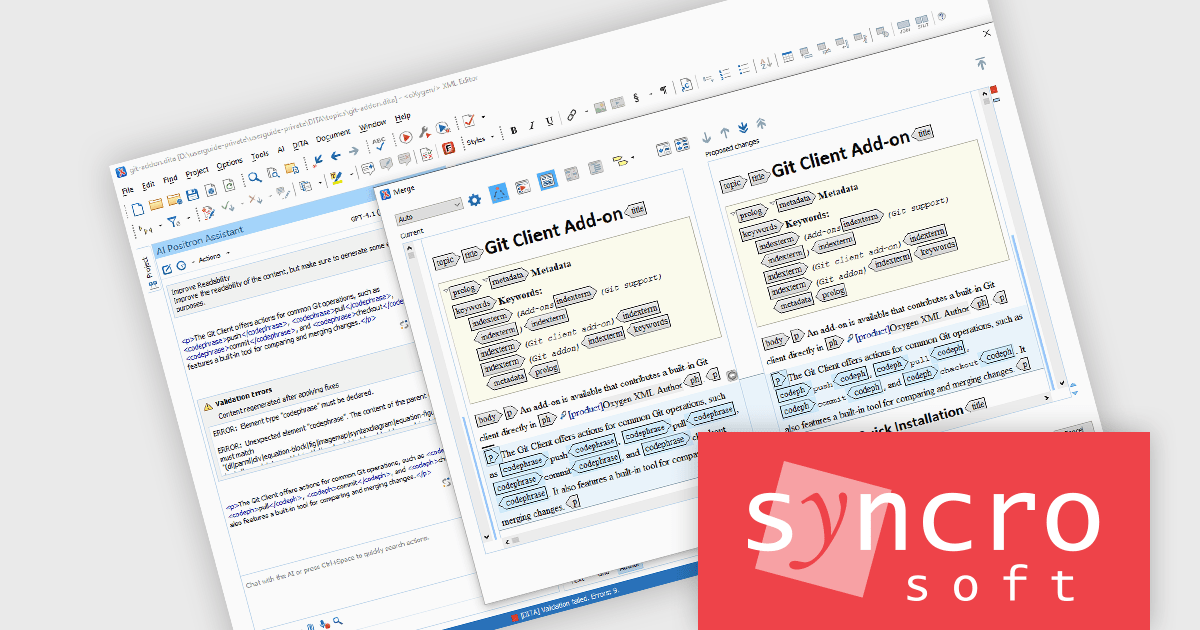
The Oxygen AI Positron Assistant Enterprise Plug-in by Syncro Soft is an Artificial Intelligence powered extension for the Oxygen XML editing suite designed specifically for technical writers. It leverages OpenAI, Microsoft Azure OpenAI Service, or Anthropic Claude to automate repetitive tasks, improve content structure and flow, and generate draft text based on user prompts. The plugin integrates seamlessly within the Oxygen environment, offering visual comparisons of suggested changes and allowing developers to control the creative process through ongoing prompts and revisions.
The Oxygen AI Positron Assistant Enterprise V6.0 release adds support for the automatic validation and correction of AI-generated content. By default, AI-generated content is automatically validated when it is inserted into your document. If errors are detected, the AI now automatically tries to correct them, ensuring that output is immediately compliant and production-ready.
To see a full list of what's new in V6.0, see our release notes.
Oxygen AI Positron Assistant Enterprise is licensed per Named user and is available as a Timed License with support and maintenance subscription. See our Oxygen AI Positron Assistant Enterprise licensing page for full details.
Learn more on our Oxygen AI Positron Assistant Enterprise product page.
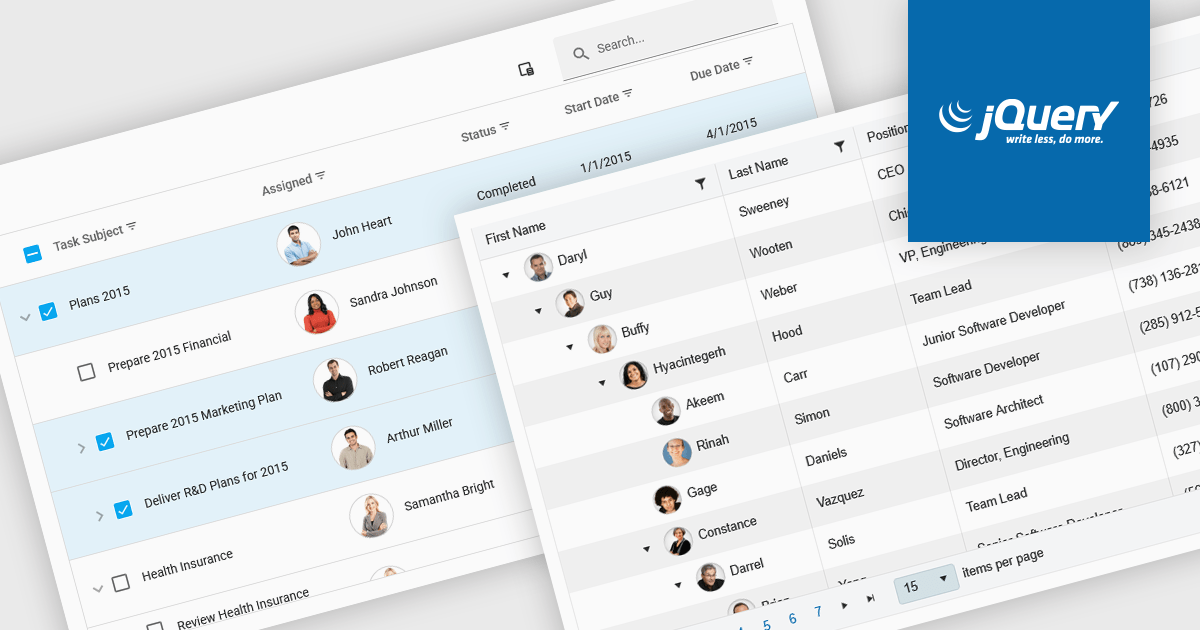
TreeLists in UI suites are specialized components designed to display hierarchical, self-referencing data in a tabular format with expandable and collapsible rows. They combine the structure of a tree view with the functionality of a data grid, offering built-in features such as sorting, filtering, editing, and paging. This makes them ideal for scenarios where complex relationships must be presented clearly, such as organization charts, project task structures, file directories, or product categories. Their intuitive layout and powerful data management capabilities help streamline workflows and enhance the user experience in enterprise and business applications.
Several jQuery UI suites feature a treelist control including:
For an in-depth analysis of features and price, visit our jQuery UI Suites comparison.
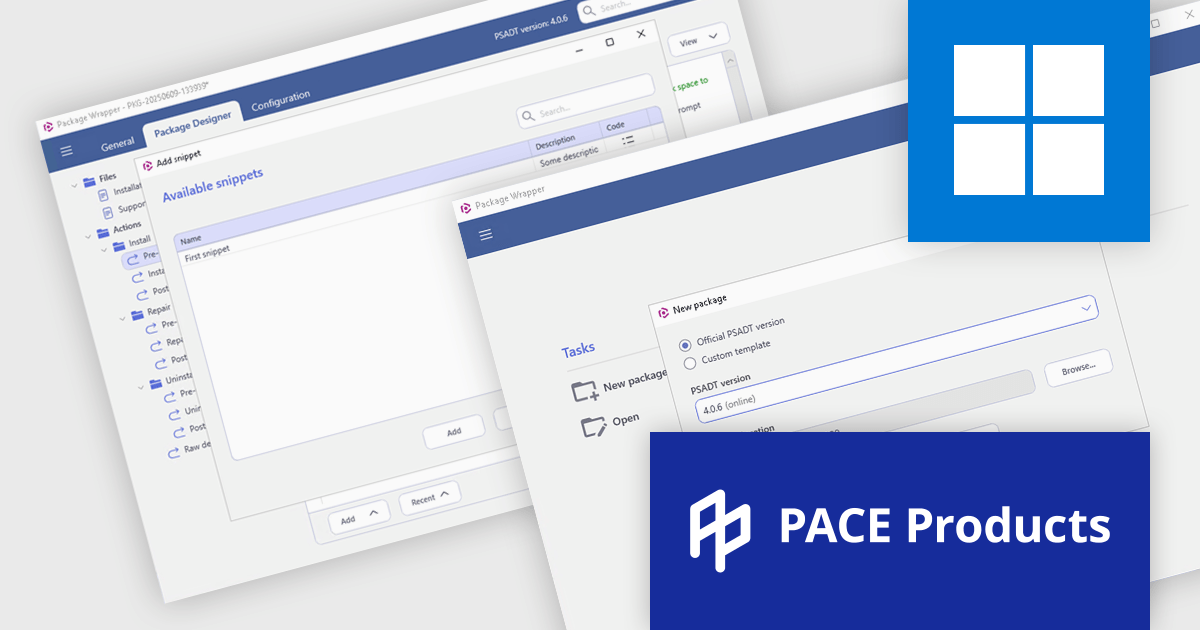
PACE Suite by Infopulse is an application packaging tool that streamlines the creation, editing, and deployment of software installers. It supports various formats like MSI, MSIX, and AppX, and allows for capturing installations, customizing packages, and automating quality checks. Additionally, PACE Packager Hub, a companion product, provides workflow management and team collaboration functionalities for efficient application packaging operations.
The PACE Suite 6.5 update introduces full support for PSAppDeployToolkit (PSADT) version 4, allowing users to work seamlessly with the toolkit's updated syntax and structural changes. PSADT v4 represents a significant shift in how deployment scripts are written and managed, and this update ensures that users can adopt those changes without disruptions. By aligning with the latest version, PACE Suite enables more reliable script execution, easier maintenance of deployment logic, and future-proof compatibility with evolving enterprise deployment standards. This is particularly valuable for IT teams managing complex software rollouts in Windows environments.
To see a full list of what's new in 6.5, see our release notes.
PACE Suite is licensed per user and is available as both subscription and perpetual licenses. See our PACE Suite licensing page for full details.
For more information, visit our PACE Suite product page.
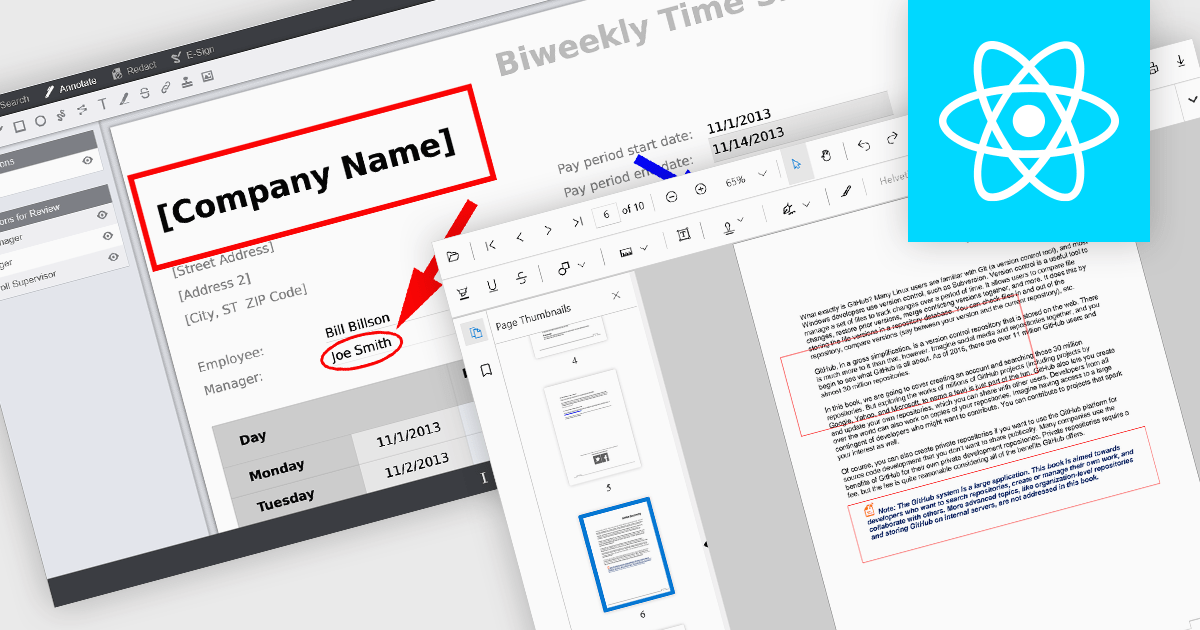
Rectangle annotations in PDF viewer components enable users to highlight, mark, or comment on specific areas within a PDF document by drawing rectangular shapes. This feature is commonly used for reviewing documents, collaborating on content, or emphasizing sections in technical or legal workflows. It enhances user interactivity within the viewer, allowing for visual references and context-specific notes without altering the original document content.
Several React PDF viewer controls offer rectangle annotations including:
For an in-depth analysis of features and price, visit our React PDF viewer controls comparison.
联系电话: (888) 850 9911
传真: +1 770 250 6199


