


官方供应商
我们作为官方授权经销商,直接提供超过200家开发厂家所发行超过1000个的产品授权给您。
查看我们的所有品牌。
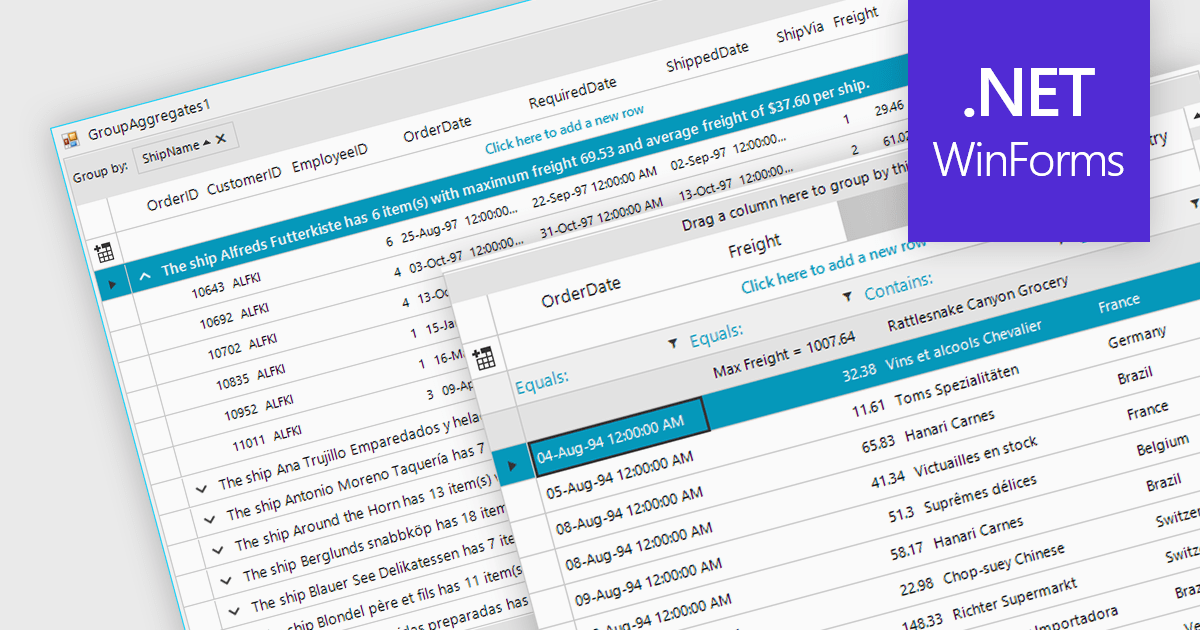
Aggregation in is the process of summarizing or combining multiple data points into a single value to provide a comprehensive overview of the dataset. Commonly used in grids, this technique can include operations such as calculating sums, averages, counts, minimums, and maximums, and is crucial for efficiently analyzing large volumes of data. It enhances data interpretability by reducing complexity, allowing users to quickly identify trends, patterns, and outliers. It can also improve performance by reducing the amount of data that needs to be processed and displayed, making it easier to manage and interact with extensive datasets.
Several WinForms grid components support aggregation, including:
For an in-depth analysis of features and price, visit our comparison of WinForms grid components.
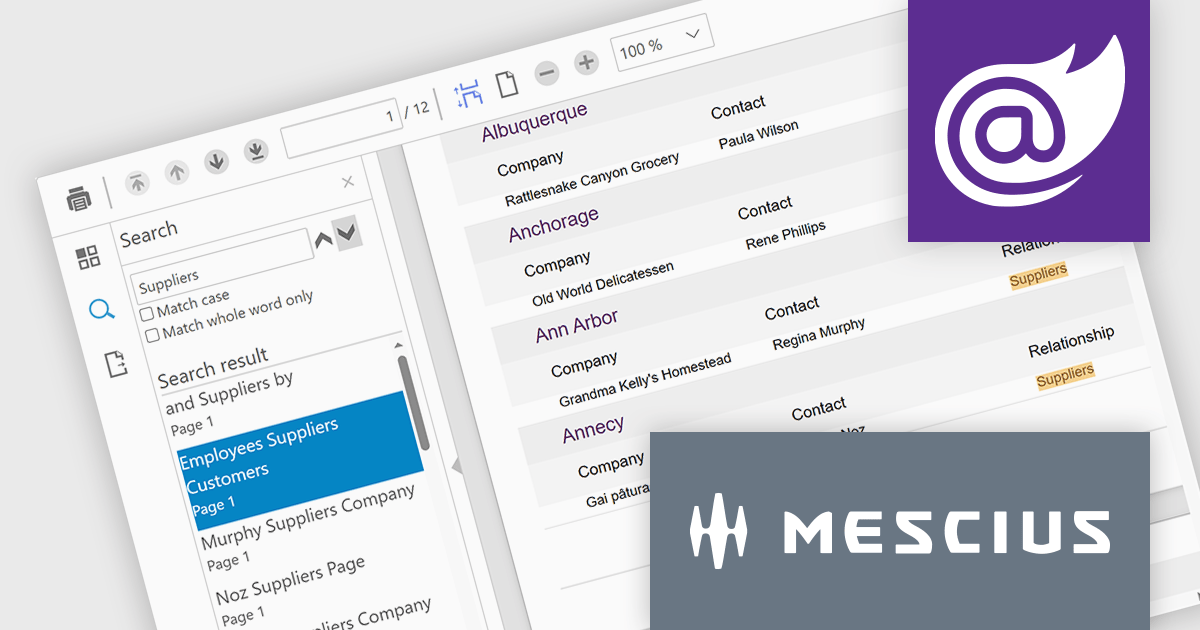
ComponentOne Studio Blazor Edition by MESCIUS empowers developers to leverage their existing C# skills to build rich web applications. This comprehensive suite includes high-performance, native Blazor UI controls like FlexGrid, a powerful datagrid with data virtualization, and 50+ chart types for data visualization. It also offers essential input controls like Autocomplete and Combobox, boosting development efficiency and creating a seamless experience for both developers and users.
The ComponentOne Studio Blazor Edition 2024 v1 release introduces the new FlexViewer control. This Blazor Server control simplifies integrating report and PDF viewing into your Blazor applications. FlexViewer empowers users with intuitive features like page navigation, search, touch support, and continuous scrolling. It also enhances productivity by allowing file export in various formats including PDF, HTML, Excel, Word, and images. This makes FlexViewer ideal for scenarios like delivering financial reports, displaying legal documents, or showcasing product brochures – all within your Blazor applications.
To see a full list of what's new in 2024 v1, see our release notes.
ComponentOne Studio Blazor Edition is licensed per developer on a perpetual basis and includes a 12 month subscription. See our ComponentOne Studio Blazor Edition licensing page for full details.
ComponentOne Studio Blazor Edition is available to buy in the following products:
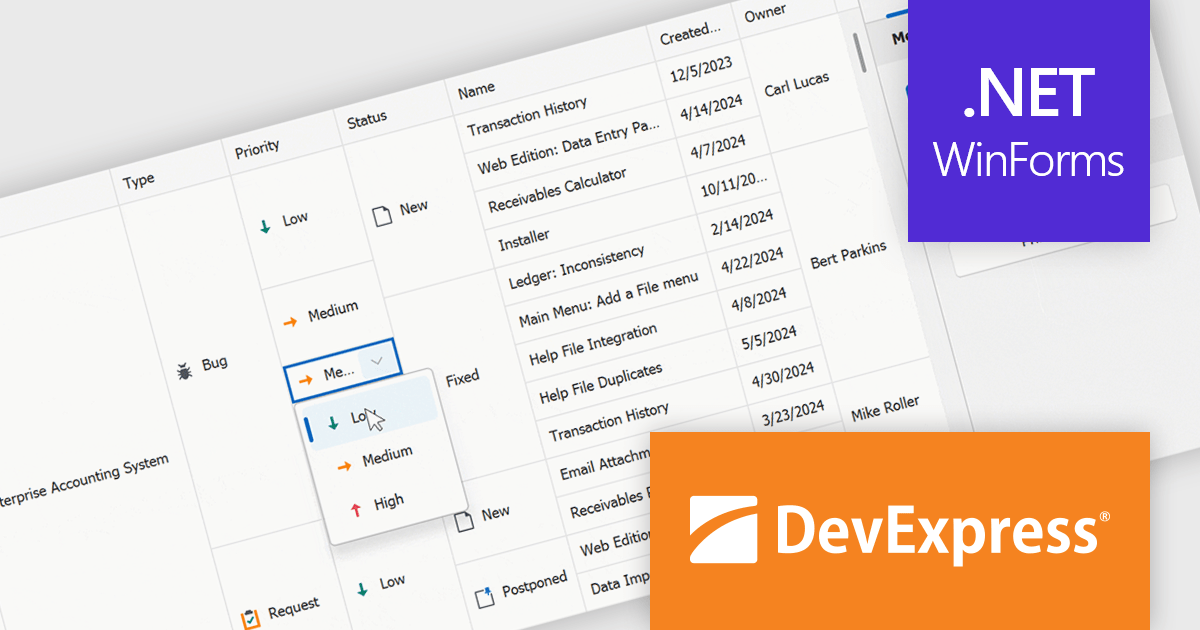
DevExpress WinForms is a comprehensive suite of 190+ UI controls and development tools designed for building high-performance desktop applications. It offers a broad array of customizable controls, from data grids and ribbon interfaces to advanced charts, maps, and diagramming components. This empowers developers to rapidly create functionally rich applications, while adhering to accessibility guidelines and touch-enabled technology for modern Windows environments.
The DevExpress WinForms 24.1 release introduces a powerful new feature for working with merged cells in the GridView and BandedGridView controls: merged cell editing. This enhancement empowers users to edit data with increased flexibility. They can now either modify all values within a merged range simultaneously, ideal for maintaining consistency across related data points, or edit individual cells within the merged area, perfect for scenarios where specific values require unique changes. This improved functionality caters to a wider range of data structures and editing workflows, boosting overall productivity and efficiency.
To see a full list of what's new in version 24.1, see our release notes.
DevExpress WinForms is licensed per developer and is available as a Perpetual License with a 12 month support and maintenance subscription. See our DevExpress WinForms licensing page for full details.
DevExpress WinForms is available to buy in the following products:
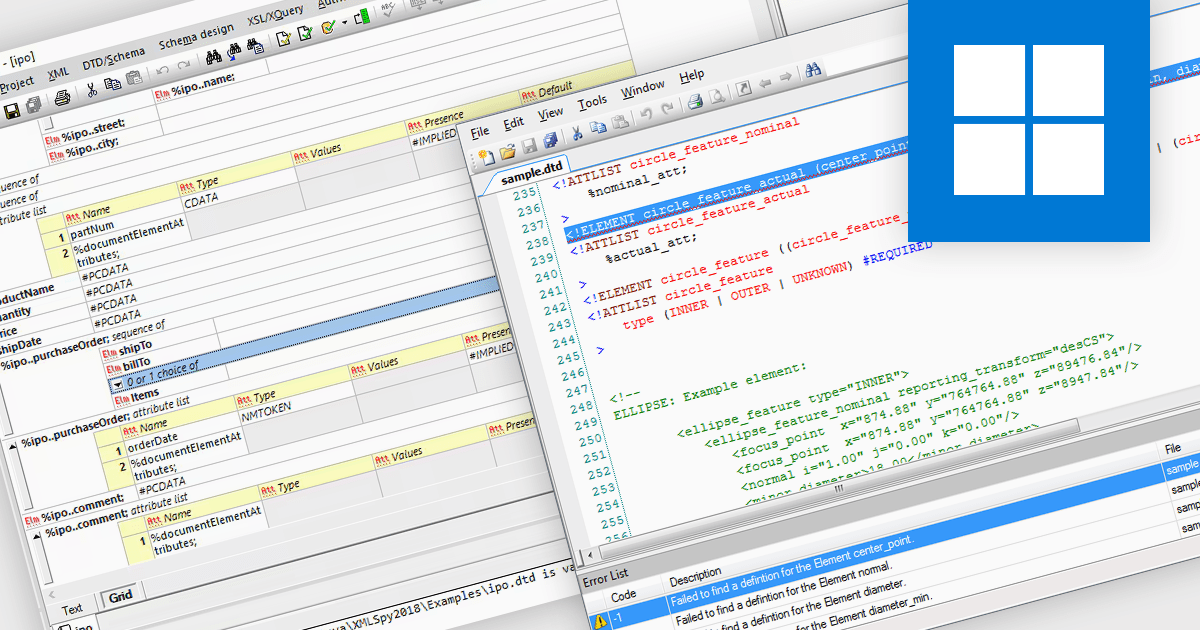
The Document Type Definition (DTD) acts as a blueprint for structuring and validating XML documents. DTD editing involves defining elements and their attributes, specifying content models that dictate how elements nest within each other, and setting constraints on data types to ensure information adheres to a specific format. DTD editing tools typically offer visual or code-based editing options, allowing developers to tailor the DTD to precisely define the allowable structure and content of their XML data.
Several structured document tools offer DTD Editing including:
For an in-depth analysis of features and price, visit our structured document tools comparison.
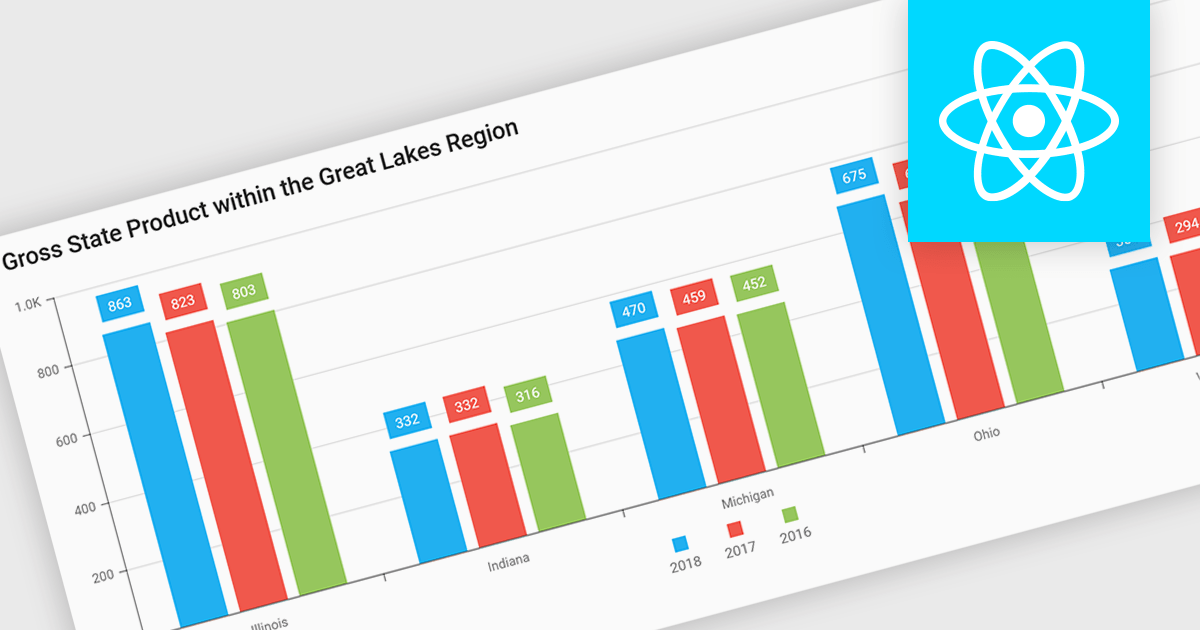
Bar and column charts, though sometimes referred to interchangeably, are vital tools for visualizing data within software applications. Their simple format, with bars representing categories and their lengths proportional to corresponding values, allows users to quickly grasp comparisons between different data sets. This makes them ideal for dashboards displaying sales figures across regions, project management tools tracking task completion rates, or any scenario where users need to compare metrics at a glance. Their effectiveness lies in their ability to present complex information in a clear and concise manner, facilitating informed decision-making within software applications.
Several React Chart controls offer column and bar charts including:
For an in-depth analysis of features and price, visit our React Chart controls comparison.
联系电话: (888) 850 9911
传真: +1 770 250 6199


