


官方供应商
我们作为官方授权经销商,直接提供超过200家开发厂家所发行超过1000个的产品授权给您。
查看我们的所有品牌。
Progress ThemeBuilder by Telerik is a comprehensive visual design tool that accelerates user interface customization for Telerik and Kendo UI web components. ThemeBuilder enables you to style virtually every appearance-related property of the UI components, from top-level elements to the smallest of details, without requiring direct CSS manipulation. It integrates with existing development processes and allows developers to create, modify, and maintain consistent and visually appealing themes across applications. This tool significantly reduces the time and effort required for UI customization and makes it easy to align them with branding and design specifications.
The Progress ThemeBuilder 2026 Q2 update introduces support for the new Meridian theme, giving developers greater flexibility to design and customize modern user interfaces through an integrated theming workflow. With access to updated styles, components, and design tokens directly within ThemeBuilder, teams can more easily create polished and consistent application experiences that align with the latest Kendo UI design system. The update also streamlines theme management and customization, helping developers accelerate UI development while maintaining visual consistency and brand alignment across projects.
To see a full list of what's new in 2026 Q2, see our release notes.
Progress ThemeBuilder is licensed per user and is available as an annual license with a one year support subscription, which is available in three tiers: Lite, Priority or Ultimate. See our Progress ThemeBuilder licensing page for full details.
For more information, see our Progress ThemeBuilder product page.
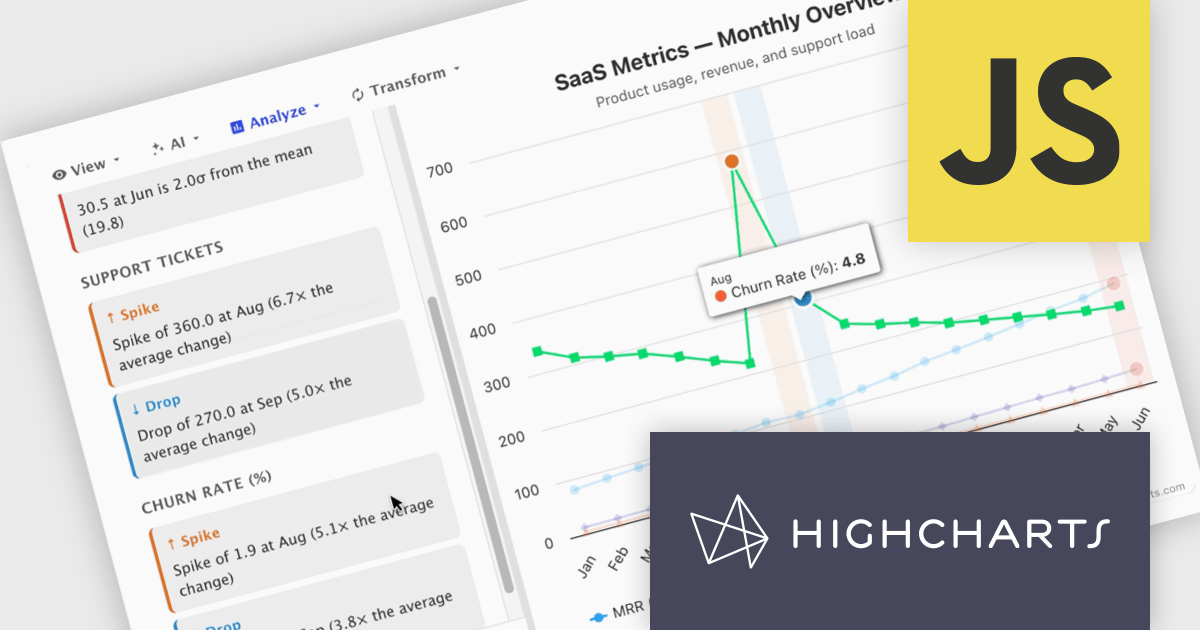
Highcharts Core (formerly Highcharts JS) is an SVG-based, multi-platform charting library that has been actively developed since 2009. It makes it easy to add interactive, mobile-optimized charts to your web pages and mobile projects. It features robust documentation, advanced responsiveness, and industry-leading accessibility support.
In this blog post, Highcharts' Nancy Dillon introduces you to Highcharts Orbit - A full analytics layer for any Highchart that helps you understand your data via a suite of analysis tools for forecasting, anomaly detection, and reporting. Add it to any Highcharts setup and a toolbar appears above the chart, giving you access to these powerful tools using four menus:
Read the complete blog post and download the fully-featured Preview version now!
Highcharts Core is licensed on an annual or perpetual basis, OEM licenses, and Advantage Renewals. It is licensed per Developer and has several license options including Internal, SaaS, SaaS+, and Self Hosted. See our Highcharts Core licensing page for full details.
Learn more on our Highcharts Core product page.
DataSpell was created by JetBrains to focus on the needs of data science and analytics professionals within the JetBrains ecosystem. It provided a dedicated experience for working with Jupyter notebooks, data exploration, and analytical workflows. These improvements have been successfully integrated into PyCharm, where they can benefit a much broader audience. As such, DataSpell is no longer available for purchase effective 28-May-2026
Starting from 1-Sep-2026, JetBrains will help existing DataSpell users transition to PyCharm. To make this transition as smooth as possible, eligible DataSpell customers will be able to transition to PyCharm at no additional cost. Current DataSpell users also maintain access through a fallback license.
This transition will happen in stages:
Read the complete JetBrains blog to get all of the necessary information regarding this transition.
Infragistics Ignite UI for Web Components is a library of standards-based UI components designed to help developers build modern, high-performance web applications using native browser technologies. It provides a rich collection of data-intensive controls, including data grids, charts, and editors, all built as reusable custom elements. The library focuses on delivering responsive user experiences, strong accessibility support, and advanced data visualization capabilities, enabling development teams to create enterprise-grade applications while maintaining flexibility in their technology choices.
The latest Ignite UI for Web Components release introduces four AI skill files that are included directly in the npm package. These structured guidance files provide GitHub Copilot, Claude, Cursor, and other large language model (LLM) coding agents with library-specific instructions for common development tasks. By giving AI assistants a deeper understanding of recommended patterns, component usage, and implementation approaches, the skills help developers generate more accurate code suggestions and achieve better results when building applications with Ignite UI for Web Components.
Infragistics Ignite UI for Web Components is part of Infragistics Ignite UI which is licensed per developer and is available as a Perpetual License with a 1, 2 or 3 year support and maintenance subscription. See our Infragistics Ignite UI licensing page for full details.
Infragistics Ignite UI for Web Components is available in the following products:
Starting 23-Jun-2026, JetBrains is updating how YouTrack Server licensing works for new customers. All licenses purchased from 23-Jun-2026 or later will be Annual Subscription licenses.
Nothing changes for customers with YouTrack Server perpetual licenses purchased before 23-Jun-2026. You can continue using YouTrack Server for as long as you need. You can also continue renewing your updates and support subscription and upgrading your user pack exactly as before.
New customers purchasing YouTrack Server from 23-Jun-2026. You will receive an annual subscription instead of a perpetual license. You can renew this subscription each year or expand it when needed.
Be sure to order now before 23-Jun-2026 - if you want to add any new perpetual licenses of YouTrack.
For more information, visit our YouTrack product page.
联系电话: (888) 850 9911
传真: +1 770 250 6199


