


官方供应商
我们作为官方授权经销商,直接提供超过200家开发厂家所发行超过1000个的产品授权给您。
查看我们的所有品牌。
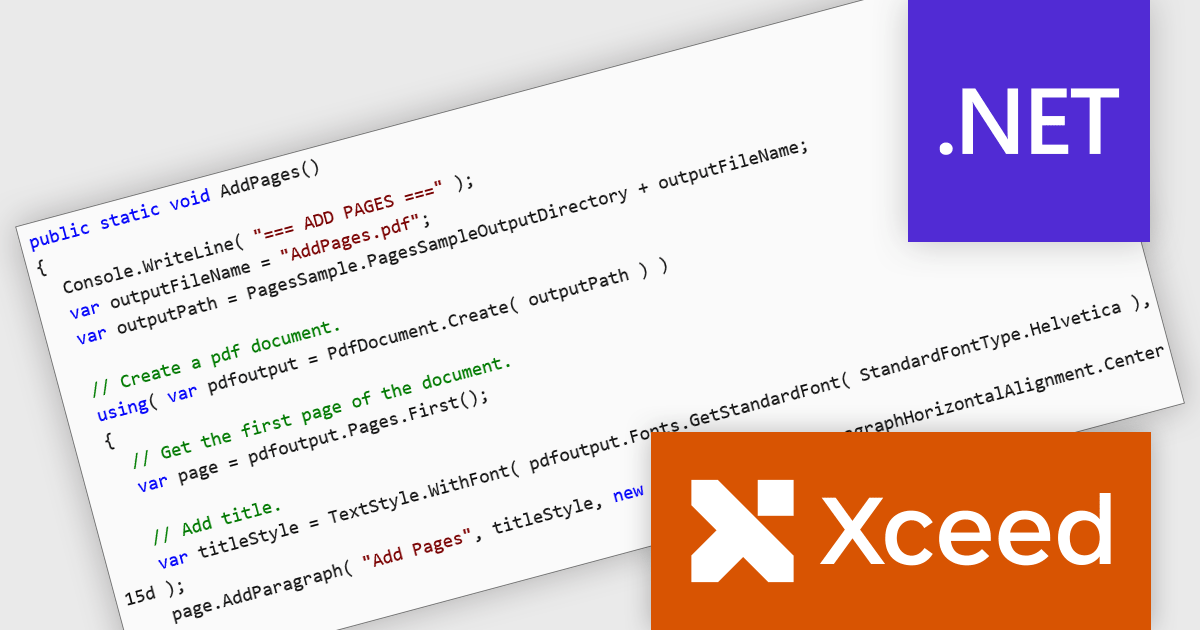
Xceed PDF Library for .NET by Xceed Software is a developer-focused component that enables interaction with PDF documents directly within .NET applications. It provides a clean, intuitive API for creating, editing, and processing PDFs, allowing users to add, modify, or extract content such as text and images without relying on external tools or dependencies.
Designed for reliability and ease of integration, the library supports key features including digital signatures, document encryption, and permission controls to help secure sensitive information. These capabilities make it well suited for a wide range of use cases, from automating document generation and updating existing PDFs to applying security policies and extracting data for reporting or archiving. Ideal for both desktop and server-side applications, Xceed PDF Library for .NET helps teams improve PDF processes while maintaining control and consistency.
Xceed PDF Library for .NET is licensed per developer and is available as a perpetual license with 1 year of updates and support. See our Xceed PDF Library for .NET licensing page for full details.
For more information, visit our Xceed PDF Library for .NET product page.
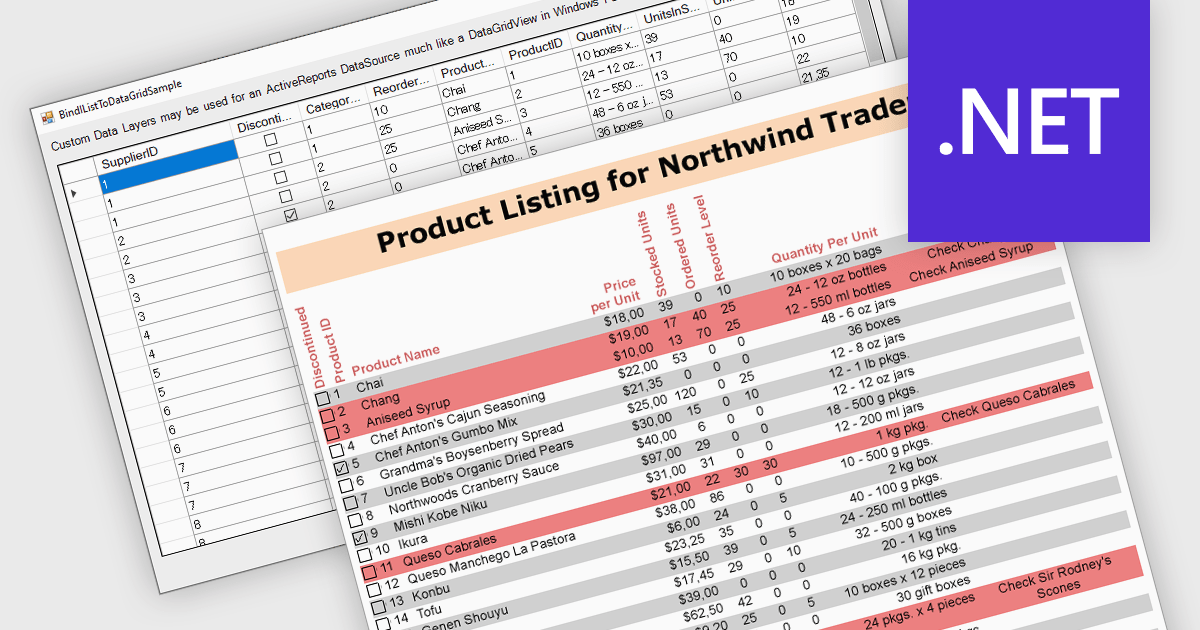
IList data source support in .NET Reporting components allows developers to bind reports directly to in-memory collections that implement the IList interface, such as generic lists or arrays. This capability offers flexibility for working with dynamically generated data or data not stored in a traditional database, making it easier to integrate with object-oriented models. It reduces the need for intermediary storage, supports runtime data manipulation, and is particularly effective in applications where data is constructed or retrieved at runtime through APIs rather than direct database access.
Several .NET Reporting controls offer IList data connectivity including:
For an in-depth analysis of features and price, visit our comparison of .NET Reporting controls.
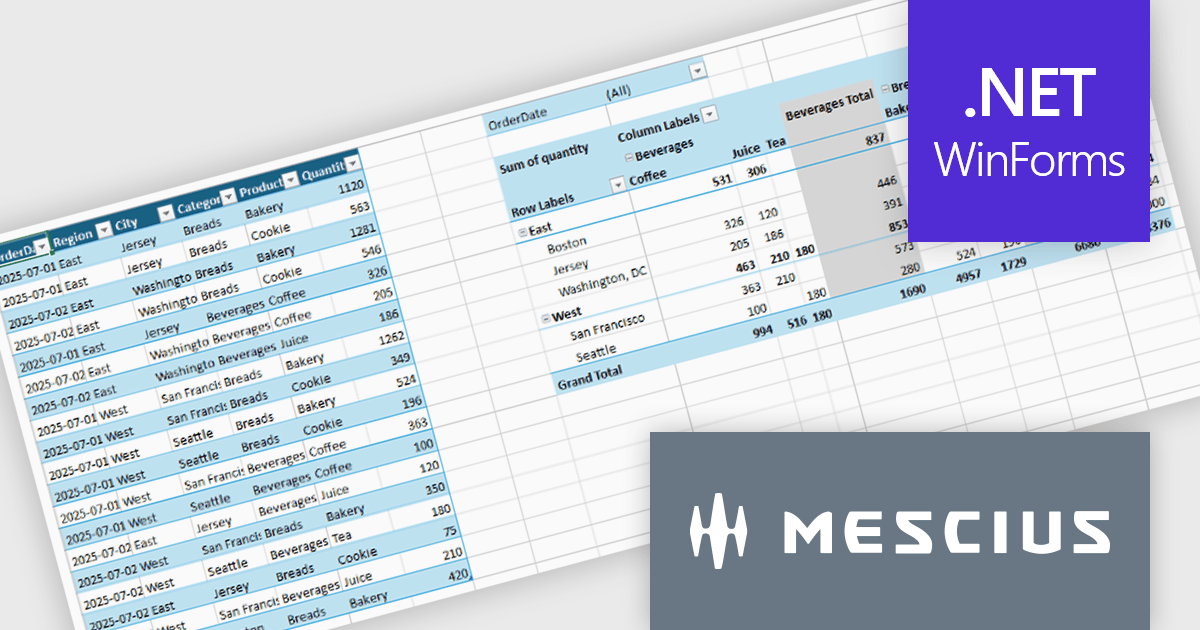
Spread.NET by MESCIUS is a tool for building Excel-like applications in your .NET projects. It lets you create interactive spreadsheets, grids, dashboards, and even forms within WinForms, ASP.NET, and WPF applications. With its rich feature set, including a robust calculation engine, formula support, and Excel compatibility, Spread.NET helps developers to build data analysis tools, budgeting apps, scientific dashboards, and more, all within the familiar .NET environment.
The Spread.NET v19 update introduces a new pivot table engine that enables software developers to summarize, analyze, and explore large datasets directly within WinForms applications. This built-in capability supports interactive grouping, filtering, and multidimensional analysis inside the spreadsheet, allowing users to work with complex data without exporting it to external reporting or business intelligence tools. By delivering Excel-like pivot table functionality with high performance and programmatic control, the pivot engine helps developers simplify application architecture, reduce dependencies, and provide a more integrated and responsive data analysis experience for end users.
To see a full list of what's new in v19, see our release notes.
Spread.NET is licensed per developer and is available as a Perpetual License with a 12 month support and maintenance subscription. We can supply any Spread.NET license including new licenses, maintenance renewals, and upgrade licenses. See our Spread.NET licensing page for full details.
For more information, visit our Spread.NET product page.
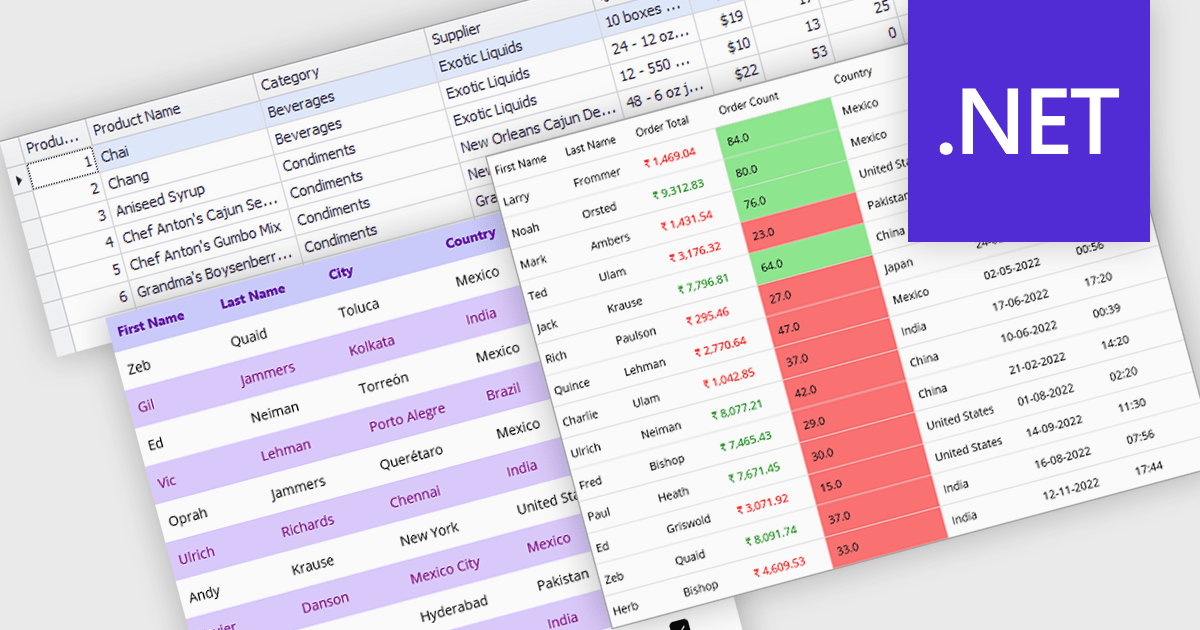
Data grids with column spanning functionality can be configured so the columns collectively extend to fill the entire width of the container, eliminating unused or empty space at the grid's edges. This behavior ensures that available horizontal space is distributed across columns rather than leaving fixed-width gaps, resulting in a more balanced and visually consistent layout. The primary benefits are improved readability, more efficient use of screen space, and a layout that adapts smoothly to resizing and different display sizes without requiring manual adjustment of individual column widths.
Several .NET grid components allow column spanning, including:
For an in-depth analysis of features and price, visit our comparison of .NET grid components.
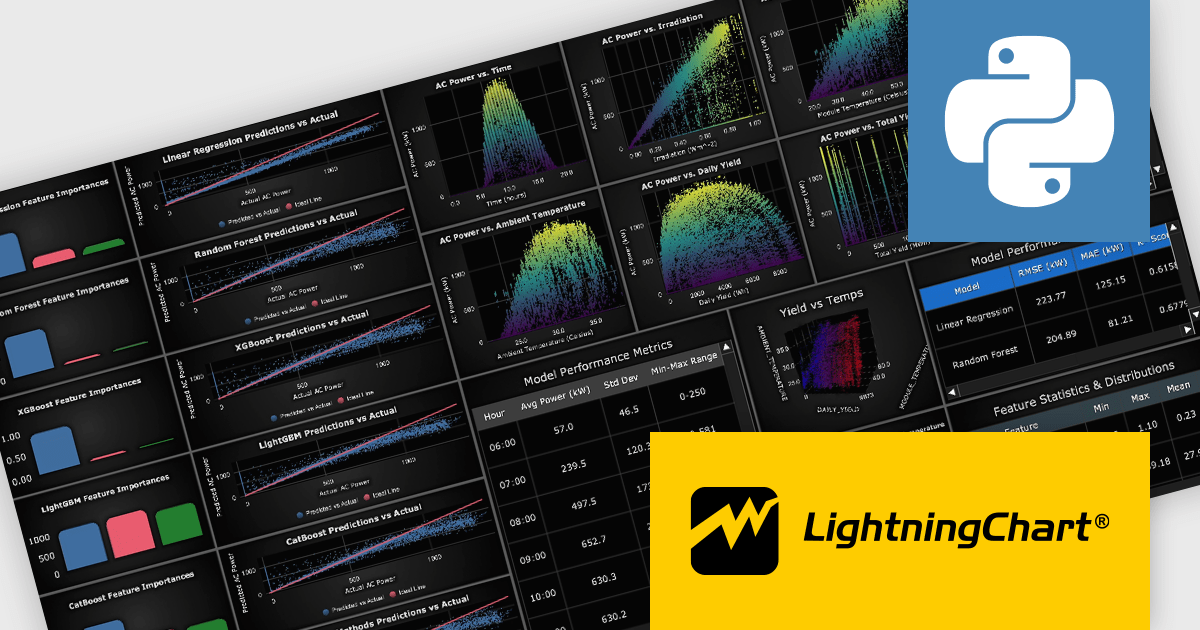
LightningChart Python is a high-performance visualization library designed for real-time analytics and large-scale data rendering. Utilizing GPU acceleration and WebGL, it efficiently processes millions of data points in 2D and 3D with smooth, interactive visuals. Some example chart types include Line graphs, Scatter plots, Heatmaps, Area plots, Box plots, 3D Surface graphs and Mesh plots, and it supports UI elements such as CustomTicks, interval Bands and Constant Lines. It integrates with Python’s data ecosystem, including numpy, pandas, and GUI frameworks like PyQt and PySide, making it a powerful tool for interactive dashboards, financial analytics, scientific simulations, and engineering applications.
The LightningChart Python v2.1 update introduces a new DataGrid component that allows software developers to present metrics, KPIs, and trend information in a single, structured view, combining textual data, numeric values, and compact in-cell charts. By embedding visual context such as sparklines, markers, and thresholds directly within the grid, developers can deliver clearer, more actionable insights without relying on separate chart components. The DataGrid also provides extensive control over styling, enabling consistent integration with existing application designs while reducing the effort required to build and maintain custom data presentation solutions.
To see a full list of what's new in v2.1, see our release notes.
LightningChart Python offers two licensing options: the subscription-based Data Scientist License for internal, non-public facing usage and the perpetual, per-seat Software Developer License for commercial use with professional support and deployment keys. Both licenses allow one active session per user, with developer licenses assigned individually. See our LightningChart Python licensing page for full details.
For more information, see our LightningChart Python product page.
联系电话: (888) 850 9911
传真: +1 770 250 6199


