官方供应商
我们作为官方授权经销商,直接提供超过200家开发厂家所发行超过1000个的产品授权给您。
查看我们的所有品牌。
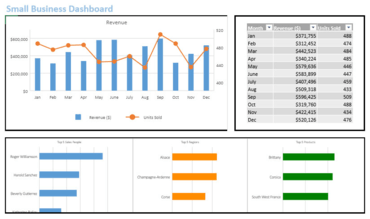
A pivot table is a powerful tool that that makes seemingly endless data more manageable to analyze. Microsoft Excel pivot tables allow users to summarize their data tables in a more meaningful way by allowing them to “pivot” (or rotate) data in tables to, for example, compare totals between different products, sort, summarize, group, and much more.
With the v14.1.0 release of SpreadJS, GrapeCity added support for pivot tables as an additional add-on feature. Users who purchase the pivot table add-on license can leverage the pivot table feature for deep customization and quick data analysis. In this blog, Mackenzie Albitz takes you through the process of how to use SpreadJS’s Pivot Table add-on feature, its application, setting utilization, and how to use the different layout options to view and analyze data seamlessly. Topics include:
View the GrapeCity blog and learn these powerful techniques.

用于 JavaScript 应用程序的完整电子表格解决方案。
透过Live Chat与我们的MESCIUS (formerly GrapeCity) 专家联络!