
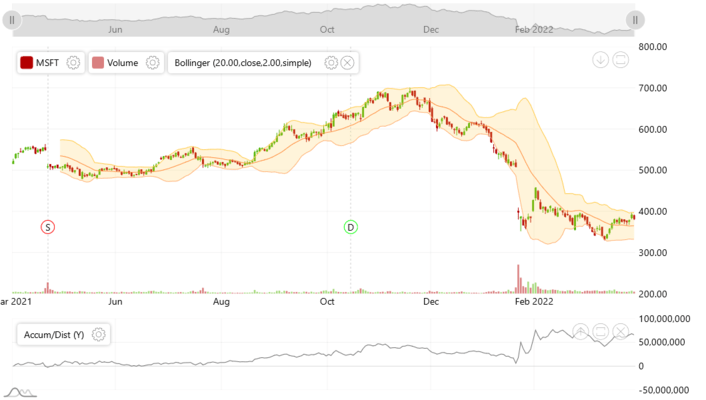
amCharts 5: Stock Chart
用于显示财务/股票和其它基于时间的数据的分析工具。
由以下开发商制作:amCharts
ComponentSource开始代理销售的日期:2019年
Discounted bundle price is available when purchased with amcharts 5: Charts.
Released: Nov 17, 2023
ClusteredPointSeries: scatterDistance and scatterRadius. These allow you to explode clusters of very close points when further zoom-in is no longer possible.Released: Nov 10, 2023
<canvas> element in chart will now have its class set to reflect its layer/order, so it can be targeted with CSS. E.g. am5-layer-0.ClusteredPointSeries have been added which allows automatically clustering closely-located bullets into groups.DataProcessor was not parsing timestamp-based string dates ('"x"') properly.strokeGradient set on an AxisRenderer was not being applied (since 5.5.5).Released: Nov 6, 2023
Released: Nov 1, 2023
StockChart indicators with OverBought/Oversold ranges were zooming to the selected series range (they should not).Released: Nov 1, 2023
Released: Oct 27, 2023
customValue to ISeriesDataItem and customValueField to Series. This allows storing additional numeric information which could be used for heat rules and other purposes.StockChart's RSI indicator.StockChart, a line is now drawn from the previous point to mouse pointer.scrollable (default: false) setting to StockChart's DropdownList and DropdownListControl (as well as other controls that...Released: Oct 19, 2023
drawingsInteractive(false) was not having an effect on some drawing tools (Vertical/Horizontal/Ray Line).CategoryAxis' elements (e.g. labels and grid) were ignoring forceHidden setting.5.4.9.Released: Oct 17, 2023
zoomTo (values: "start" and "end" (default)) has been added to PeriodSelector. If set to "start", period buttons will select from the start of the data, not from the end. "YTD" will still select to the end. PeriodSelector now supports "custom" periods.Sprite: blur, brightness, contrast, saturate, sepia, invert, hue. These filters are not supported by Apple Safari browsers.GrainPattern which allows you to add graininess effect to any element...Released: Jun 21, 2022
Updated Oct 10, 2023
SliceGrouper would use first color in series for a "group" slice if series was using a color set with custom list of colors.5.4.10).forceInactive was not working on Container.drawingsInteractive(value: bool) method in StockChart was not working properly.Updated Oct 6, 2023
StockChart settings stockPositiveColor and stockNegativeColor was being ignored in...联系电话: (888) 850 9911
传真: +1 770 250 6199


