
Froala Charts
用于为 Web 和移动应用程序创建响应式报表和仪表板的交互式图表。
由以下开发商制作:Froala
ComponentSource开始代理销售的日期:2020年
我们已经停止贩售这个产品。

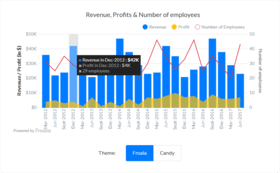
Froala Charts is a comprehensive library of JavaScript charts to create beautiful, responsive reports and interactive dashboards for web and mobile applications. Incorporating data visualization capabilities via interactive charts has been a growing need for enterprise app developers that are also using Froala Editor. Froala Charts bridges the gap. Draw quick insights from your data using the wide variety of visualizations from basic charts, widgets, to domain-specific charts and more. Choose from basic column charts, line charts, pie charts, combo charts, to powerful widgets such as gauges, KPIs, funnels, or advanced domain-specific charts such as timeseries, radar, chord, sankey, heat maps and more.


图像1/8
Froala Charts for your data visualization needs:
透过Live Chat与我们的Froala 专家联络!


联系电话: (888) 850 9911
传真: +1 770 250 6199


