
MindFusion.Charting for WebForms
将图表和仪表添加到您的 ASP.NET WebForms 应用程序中。
由以下开发商制作:MindFusion Group
ComponentSource开始代理销售的日期:2003年
我们已经停止贩售这个产品。
将图表和仪表添加到您的 ASP.NET WebForms 应用程序中。
由以下开发商制作:MindFusion Group
ComponentSource开始代理销售的日期:2003年

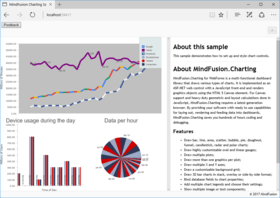
MindFusion.Charting for WebForms is a multi-functional dashboard library that draws various types of charts and gauges. It is implemented as a ASP.NET web control and can easily be integrated with any application targeting the Microsoft ASP.NET platform. By providing your software with ready to use capabilities for laying out, rendering and feeding data into dashboards, MindFusion.Charting for WebForms saves you hundreds of hours coding and debugging.

MindFusion.Charting for WebForms Features
透过Live Chat与我们的MindFusion Group 专家联络!


联系电话: (888) 850 9911
传真: +1 770 250 6199


