Offizieller Lieferant
Als offizieller und autorisierter Distributor beliefern wir Sie mit legitimen Lizenzen direkt von mehr als 200 Softwareherstellern.
Sehen Sie alle unsere Marken.
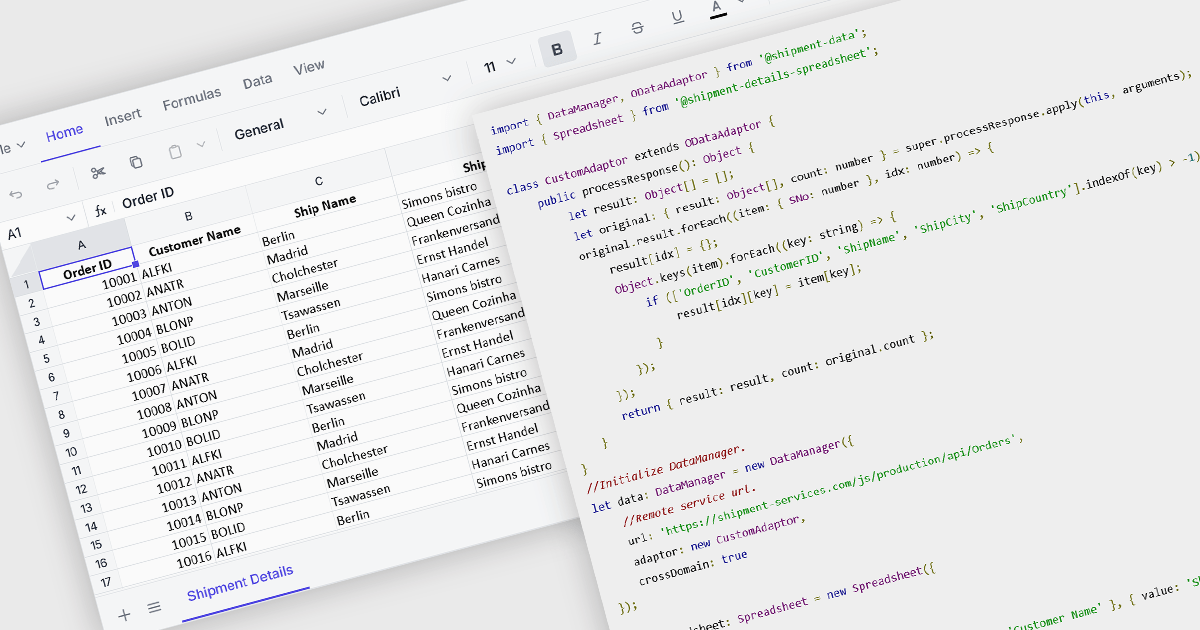
Data binding in a spreadsheet is the process of linking spreadsheet cells to external data sources, such as databases, APIs (Application Programming Interfaces), or other structured datasets, ensuring that the spreadsheet dynamically updates when the source data changes. This enables real-time synchronization, reducing manual data entry and minimizing errors. By automating data retrieval and updates, data binding enhances accuracy, supports complex calculations with live data, and improves efficiency, making it particularly useful for reporting, financial analysis, and business intelligence tasks. It also facilitates better collaboration by ensuring that all users work with the most current information, improving decision-making and overall productivity.
Several Vue.js spreadsheet components offer data binding functionality, including:
For an in-depth analysis of features and price, visit our Vue.js spreadsheet controls comparison.
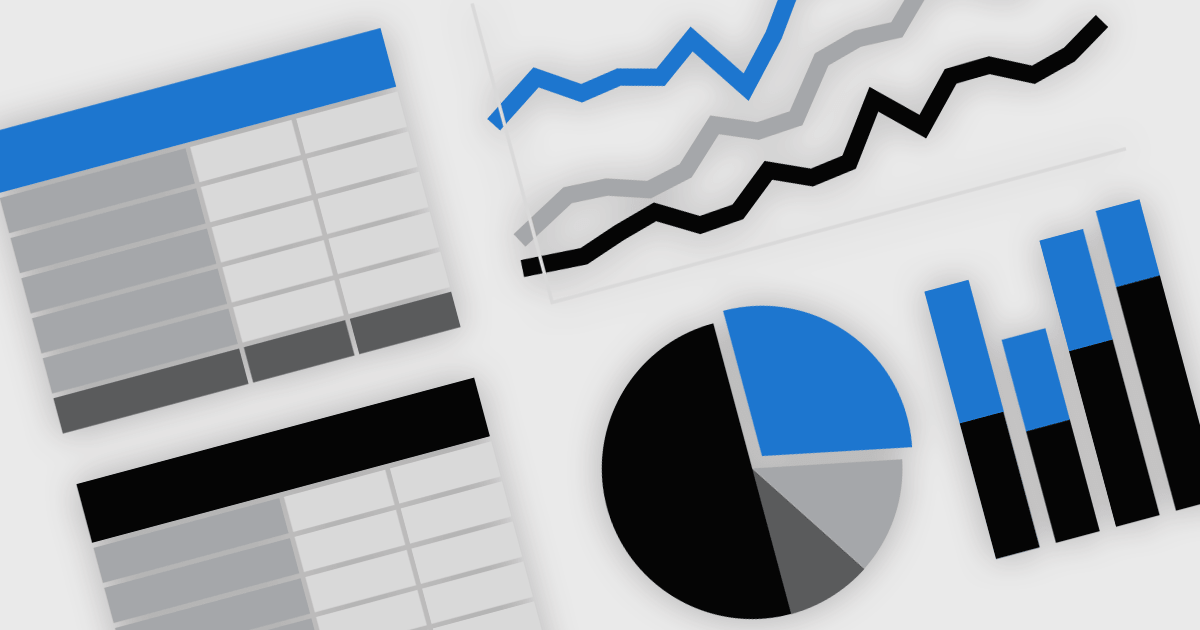
Effective data processing and presentation features are an essential part of modern reporting components, enabling users to organize, analyze, and display data in a meaningful way. These capabilities transform raw information into structured, interactive reports that support better decision-making. By allowing users to manipulate data dynamically, apply business rules, and customize the way information is displayed, these features ensure reports remain relevant, insightful, and easy to interpret across different use cases.
Common features include:
For an in-depth analysis of features and price, visit our Vue.js Reporting controls comparison.
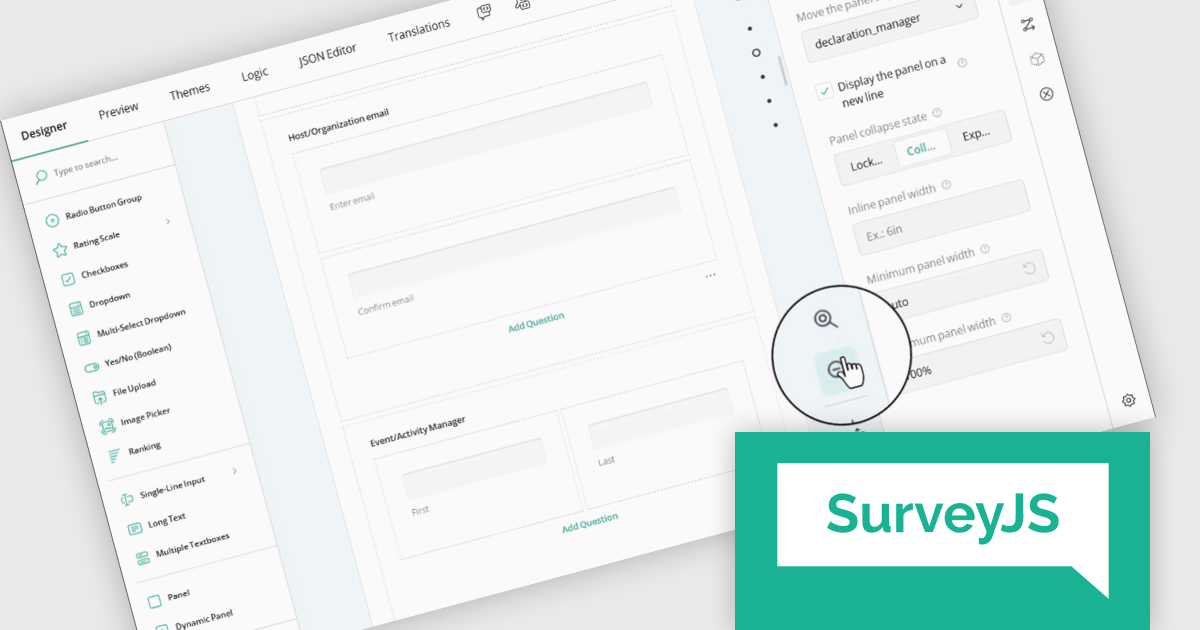
SurveyJS Survey Creator is a JavaScript library that enables developers to embed a drag-and-drop survey and form builder directly within their web applications. It provides a comprehensive UI for designing surveys with various question types, logic branching, and layout customization, generating JSON schemas that can be used by the SurveyJS Survey Library to render and process the surveys. This allows for the creation of dynamic and user-configurable data collection tools without requiring extensive custom development, streamlining the process of integrating survey functionality into applications.
The SurveyJS Survey Creator 2.0.0 release adds support for scaling, enabling users to dynamically adjust the zoom level of the survey design surface. This functionality provides control over the visual representation of forms, allowing users to zoom in for detailed editing of intricate elements or zoom out for a comprehensive overview of complex, multi-page surveys. A dedicated "Zoom to 100%" button ensures a quick and effortless return to the default view.
To see a full list of what's new in version 2.0.0, see our release notes.
SurveyJS Survey Creator is licensed per developer with a one-time payment for indefinite use. Access to updates and technical support is available through a subscription. See our SurveyJS Survey Creator licensing page for full details.
Learn more on our SurveyJS Survey Creator product page.
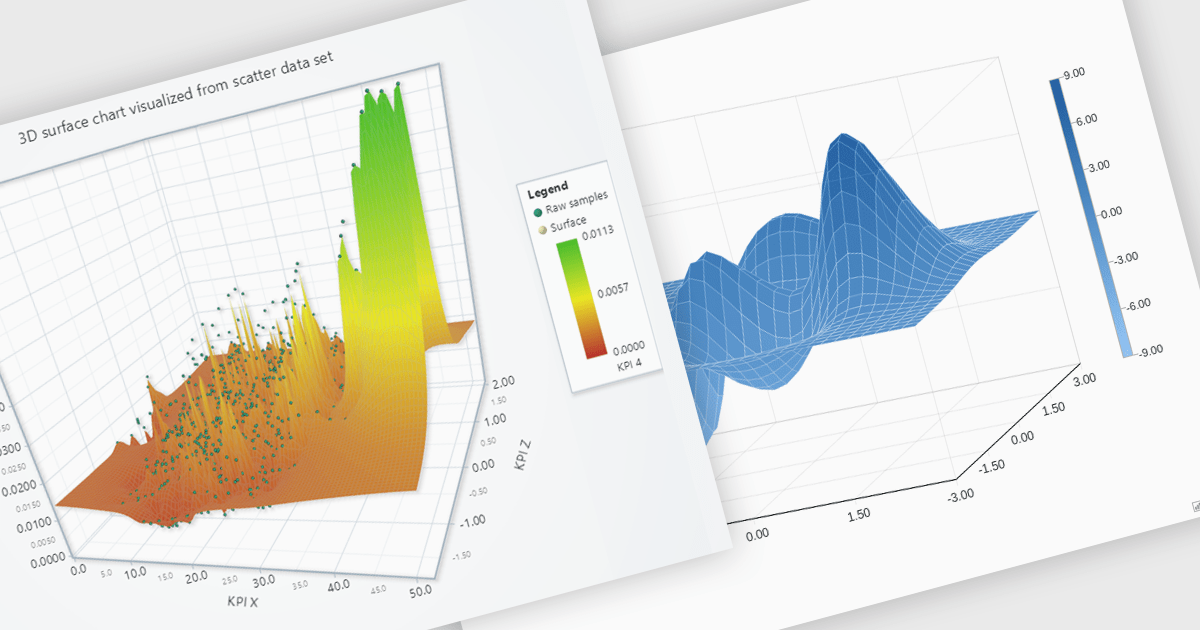
Surface charts are 3D visualizations that show relationships between three numerical variables as a continuous surface. They help identify trends and optimal values, making them useful in science, engineering, and business. Common uses include topographical mapping, financial modeling, and performance analysis. For example, businesses can use surface charts to analyze how price and demand affect revenue, helping them find the best price point. By displaying data in three dimensions, surface charts reveal insights that may not be clear in 2D charts.
Several JavaScript chart controls offer support for Surface charts, including:
For an in-depth analysis of features and price, visit our JavaScript chart controls comparison.
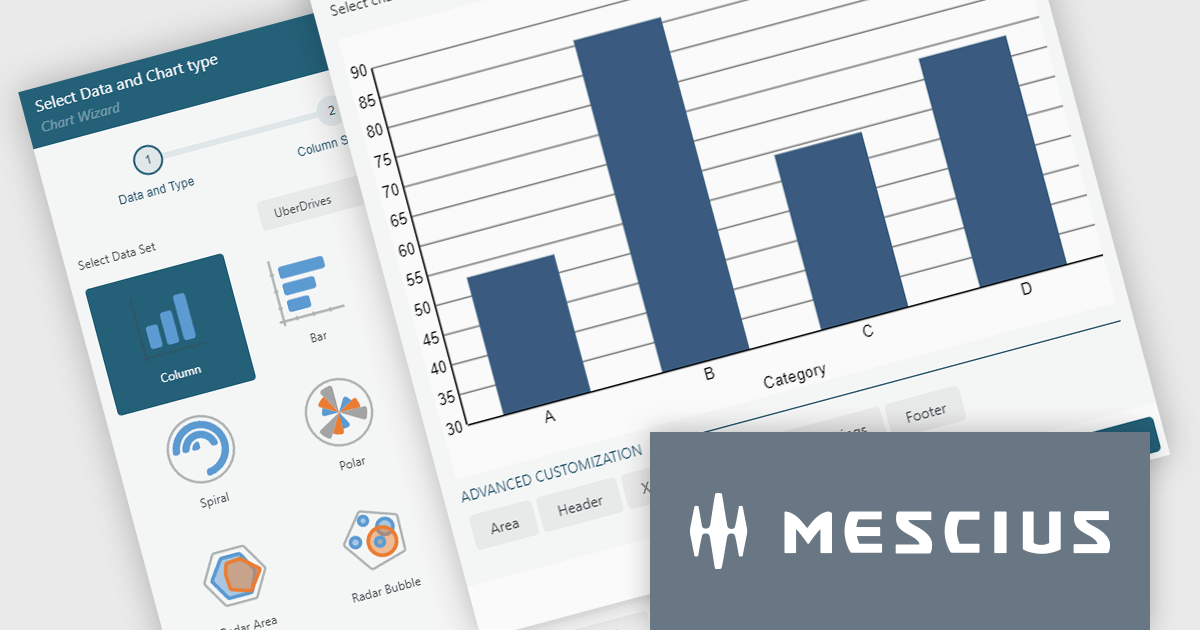
ActiveReportsJS by MESCIUS is a JavaScript reporting toolkit that empowers developers to design and embed interactive reports within web applications. It offers a standalone report designer for crafting reports and a JavaScript report viewer component for seamless integration into web frameworks like React or vanilla JavaScript. This solution streamlines report creation, facilitates data visualization, and delivers a user-friendly report experience.
The ActiveReportsJS 5.2 update introduces a completely revised chart report item, offering greater flexibility and control over data visualization. With enhanced configurability, developers can now customize data binding, axis settings, labels, and legends using dynamic expressions, allowing for more precise and adaptable chart designs. Additionally, seamless migration ensures that existing charts are automatically converted to the new model when older reports are opened in the designer, eliminating the need for manual adjustments. These improvements simplify chart configuration and make it easier to create clear and insightful reports.
To see a full list of what's new in 5.2, see our release notes.
ActiveReportsJS is licensed on an annual subscription or perpetual basis and is available as a Single Deployment License for non-commercial use, and as a Single Domain License or Unlimited Domain License for commercial and/or SaaS use. See our ActiveReportsJS licensing page for full details.
Learn more on our ActiveReportsJS product page.