













공식 공급 업체
200 이상의 소프트웨어 개발처와 판매 계약을 맺은 공인 디스트리뷰터로서 합법적인 라이선스를 제공합니다.
모든 브랜드 보기.

DevExpress BI Dashboard (part of DevExpress Universal) empowers you to craft interactive dashboards for desktop, web and mobile applications. It provides a visual designer for building dashboards without writing code, allowing you to drag-and-drop various data visualization widgets onto the canvas. These widgets connect to your data sources and update dynamically, offering real-time insights to end users. The tool also supports customization through properties and events, enabling you to tailor the look and feel of the dashboards to perfectly integrate with your application's design.
The DevExpress BI Dashboard 24.1 release adds support for cascading parameters. This powerful feature allows you to create intuitive filter hierarchies within your dashboards. Imagine selecting a value in a parent parameter, then watching as the options in a dependent parameter automatically update to reflect the chosen filter. This eliminates the need for users to manually navigate through potentially overwhelming dropdown lists, fostering a more focused and efficient experience. Cascading parameters empower you to design dashboards that guide users towards deeper insights within your data.
To see a full list of what's new in version 24.1, see our release notes.
DevExpress BI Dashboard is included as part of DevExpress Universal which is licensed per developer and is available as a Perpetual License with a 12 month support and maintenance subscription. See our DevExpress Universal licensing page for full details.
DevExpress BI Dashboard is available in the following products:
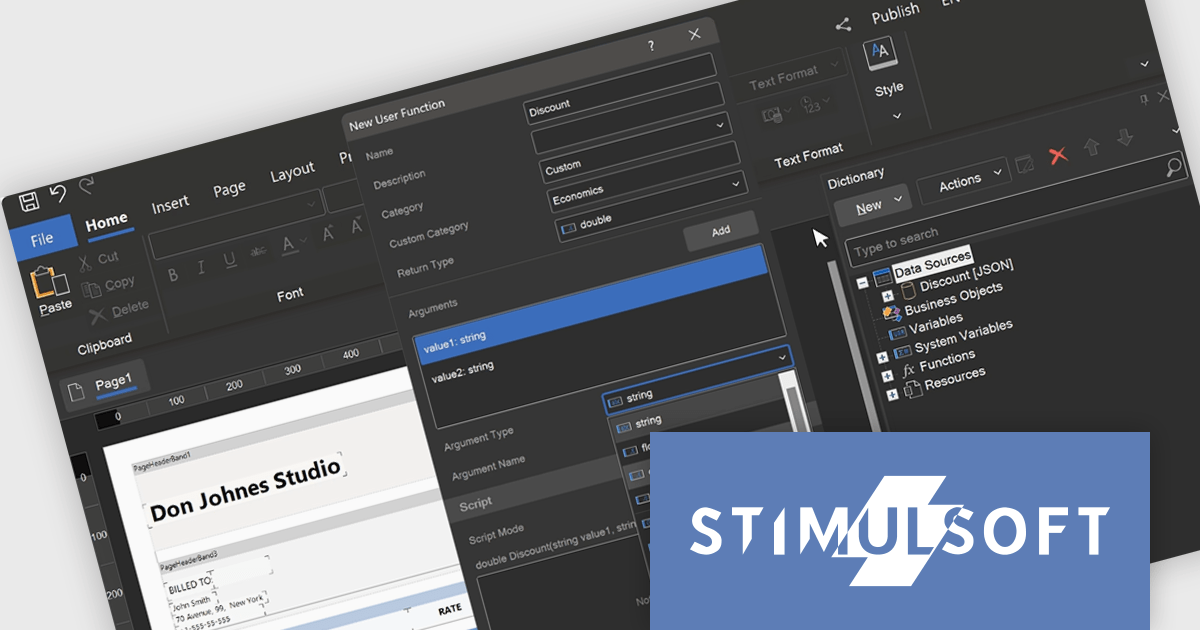
Stimulsoft Reports.WEB is a cross-platform reporting solution designed for integration within web applications. It leverages a client-server architecture for report generation, viewing, printing, and exporting directly in web browsers. Its powerful .NET report engine offers efficient report processing, a user-friendly HTML5 report designer for building reports with various data sources and visualizations, and an interactive HTML5 viewer for seamless report display within web applications. This integration allows developers to implement robust reporting functionalities without browser plugins or additional client-side dependencies.
The Stimulsoft Reports.WEB 2024.3 release empowers developers with user-defined functions within the data dictionary. This functionality extends report capabilities by allowing creation of custom logic using either the visual programming tool Blockly or directly in supported scripting languages. These user-defined functions can be seamlessly integrated into reports enabling developers to address complex calculations, data transformations, or custom formatting logic without code modifications in the main application. This streamlines development, promotes code reusability, and fosters a more dynamic reporting environment.
To see a full list of what's new in version 2024.3, see our release notes.
Stimulsoft Reports.WEB is licensed per developer and is available as a Perpetual license with 1 year support and maintenance. See our Stimulsoft Reports.WEB licensing page for full details.
Stimulsoft Reports.WEB is available in the following products:
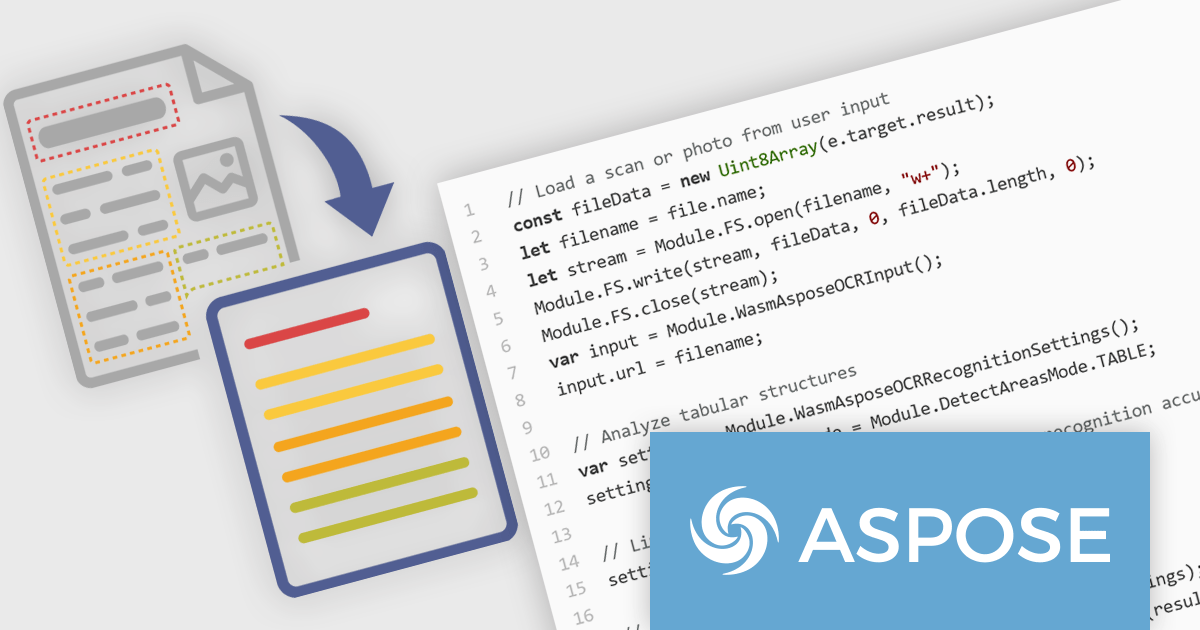
Aspose.OCR for Node.js via C++ empowers developers to integrate Optical Character Recognition (OCR) functionality into their Node.js applications. This library bridges the gap between Node.js, a popular JavaScript runtime environment, and Aspose's robust OCR engine, enabling text extraction directly from images on any platform where Node.js is installed. It supports various image formats and boasts multilingual capabilities, recognizing over 130 languages across different scripts.
Aspose.OCR for Node.js via C++ unlocks a multitude of use cases. Developers can leverage it to build on-premise document processing applications, extract text from scanned documents and photos for web services, or create serverless functions in cloud environments like AWS Lambda and Azure Functions. Its ability to handle diverse languages makes it ideal for applications catering to a global audience. By incorporating Aspose.OCR for Node.js via C++, developers can streamline workflows, automate data capture processes, and enhance the functionality of their Node.js applications.
Aspose.OCR for Node.js via C++ is offered as Developer Small Business, Developer OEM, Developer SDK, Site Small Business, Site OEM, and Site SDK licenses catering to a range of business needs. Licenses are perpetual, and include 1 year of support and maintenance. Subscription renewals are also available. See our Aspose.OCR for Node.js via C++ licensing page for full details.
Aspose.OCR for Node.js via C++ is available in the following products:

A pivot grid is a data visualization tool that allows users to interactively explore and summarize multidimensional data. By dragging and dropping fields between rows, columns, and filters, developers can empower users to dynamically create custom views of their data, facilitating data analysis and informed decision-making without writing complex queries.
Several React UI suites feature a pivot grid control including:
For an in-depth analysis of features and price, visit our React UI Suites comparison.
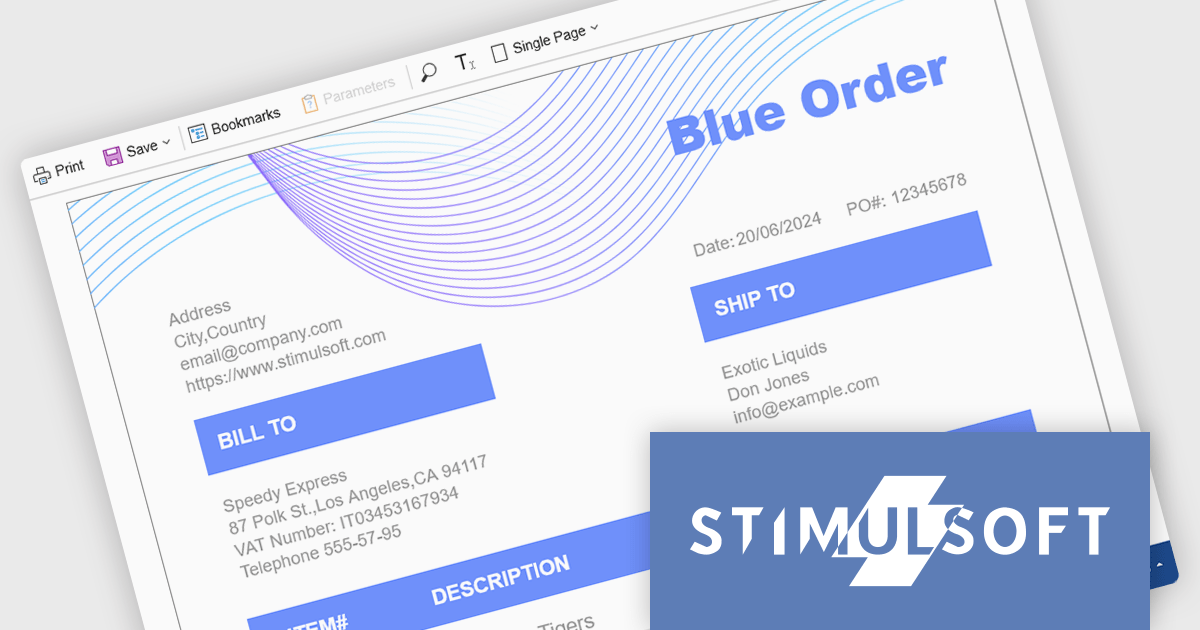
Stimulsoft Reports.PYTHON provides a collection of tools for creating, viewing, exporting, and printing reports within your Python applications. It allows you to connect to various data sources and leverage client-server technology for efficient report generation. Additionally, Stimulsoft offers powerful features for visualizing and analyzing your data.
The Stimulsoft Reports.PYTHON 2024.3 release enables developers to generate and export reports entirely on the Python server, offering greater control and flexibility. All existing reporting tool events and Python data adapters remain fully functional within this server-side environment. Server-side rendering unlocks several advantages, reducing client-side load, improving report generation speed, and enhancing security by keeping sensitive data on the server. It caters to scenarios where complex reports or data privacy concerns necessitate a server-centric approach.
To see a full list of what's new in version 2024.3, see our release notes.
Stimulsoft Reports.PYTHON is licensed per developer and is available as a Perpetual license with 1 year support and maintenance. See our Stimulsoft Reports.PYTHON licensing page for full details.
Stimulsoft Reports.PYTHON is available in the following products:
전화 : 00798 14 800 6332
팩스 : +1 770 250 6199


