













공식 공급 업체
200 이상의 소프트웨어 개발처와 판매 계약을 맺은 공인 디스트리뷰터로서 합법적인 라이선스를 제공합니다.
모든 브랜드 보기.
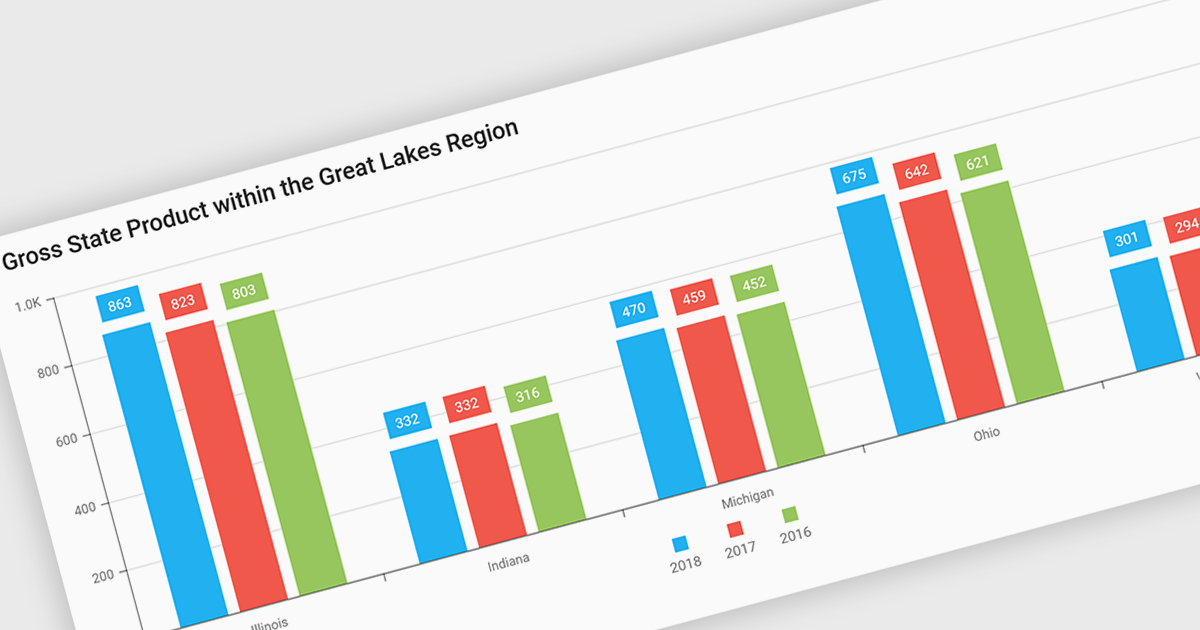
Bar and column charts, though sometimes referred to interchangeably, are vital tools for visualizing data within software applications. Their simple format, with bars representing categories and their lengths proportional to corresponding values, allows users to quickly grasp comparisons between different data sets. This makes them ideal for dashboards displaying sales figures across regions, project management tools tracking task completion rates, or any scenario where users need to compare metrics at a glance. Their effectiveness lies in their ability to present complex information in a clear and concise manner, facilitating informed decision-making within software applications.
Several React Chart controls offer column and bar charts including:
For an in-depth analysis of features and price, visit our React Chart controls comparison.
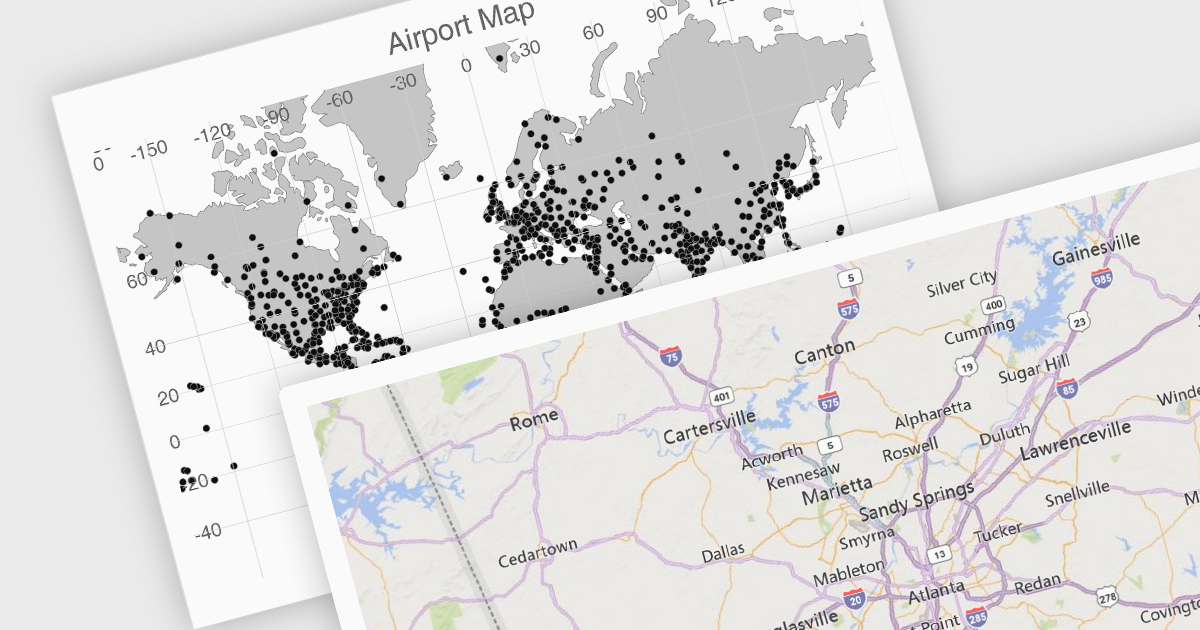
UI suites often include map components that streamline the development process for applications displaying geographical data. These components integrate seamlessly with the chosen framework, offering features like base map selection, zoom controls, and location markers. They can be customized to display real-time data visualizations, allowing users to explore trends and patterns across geographic regions. This functionality is valuable for applications in logistics, e-commerce, and any industry where location plays a key role.
Several Vue.js UI suites offer mapping functionality, including:
For an in-depth analysis of features and price, visit our comparison of Vue.js UI suites.

Froala Editor is a JavaScript-based WYSIWYG HTML editor that empowers developers to seamlessly integrate rich text editing functionalities into their applications. Despite its extensive feature set of over 100 options, Froala prioritizes user experience through a cleverly designed toolbar. Actions are categorized into four intuitive scopes, ensuring every feature is readily accessible while maintaining a clean and uncluttered interface. This balance of power and usability makes Froala Editor a versatile solution for a wide range of content creation scenarios.
Froala Editor's powerful features for creating dynamic page content include:
View the full blog post to learn more about this customizable editor for your business.
Froala Editor is licensed on an annual or perpetual basis, with annual licenses available for 1, 2, or 3 years. See our Froala Editor licensing page for full details.
For more information, see our Froala Editor product page.
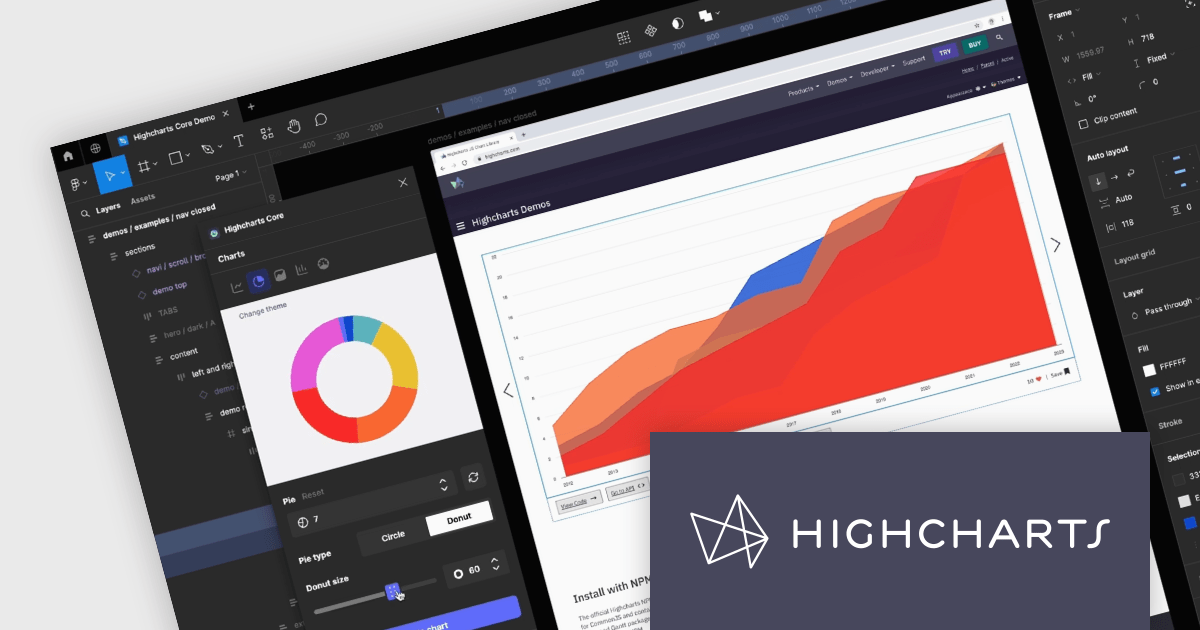
Highcharts Core by Highsoft is a powerful JavaScript charting library that simplifies the creation of interactive and accessible data visualizations for web applications. Featuring a wide variety of chart types, from basic line graphs to complex combinations, and extensive customization options, Highcharts Core (formerly Highcharts JS) allows developers to bring their data to life in a way that is both informative and engaging. This makes it ideal for use cases across various industries, from financial dashboards and scientific reports to marketing campaigns and social media content.
Highsoft has made the Highcharts Core Figma Plug-In available for free on Figma Community. Figma is a web-based design tool that allows you to create user interfaces for websites and apps. Known for its collaborative features, Figma makes it easy for design teams to work together on projects. The new plugin includes:
Read the Highcharts blog for more information about this powerful free plug-in available to licensed users of Highcharts Core.
Highcharts Core is licensed on an annual or perpetual basis, OEM licenses, and Advantage Renewals. It is licensed per Developer and has several license options including Internal, SaaS, SaaS+, and Self Hosted. See our Highsoft Core licensing page for full details.
For more information, visit our Highcharts Core product page.
IPWorks by /n software is a comprehensive development library designed to streamline your creation of internet-enabled applications. It offers pre-built, secure components for common functionalities like sending emails, transferring files, and consuming web services. This allows you to focus on your application's core logic while leveraging pre-tested, robust tools for essential internet interactions.
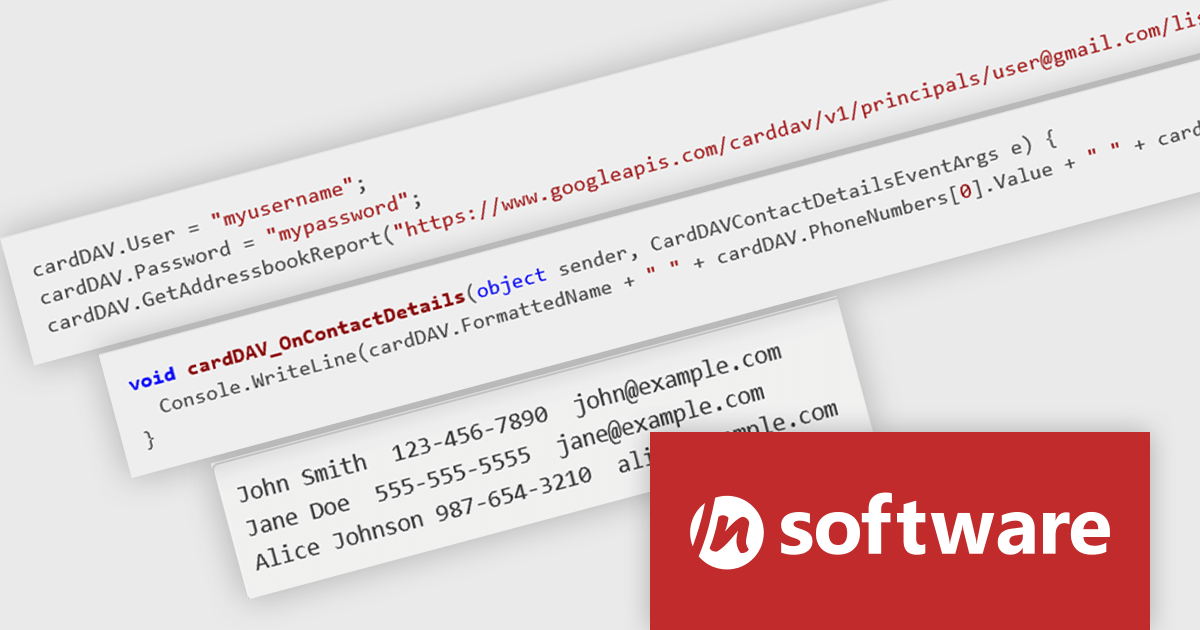
The IPWorks 2024 release streamlines contact management with its all-new CardDAV component. This integration empowers applications to seamlessly create, edit, and synchronize contacts across devices and platforms. Users can effortlessly manage address books, add, delete, copy, or move entries, all while centralizing data on a CardDAV server. This ensures everyone stays in sync and fosters improved collaboration across an organization.
To see a full list of what's new in IPWorks 2024, see our release notes.
IPWorks is licensed per developer and is available as a Perpetual License with a 12 month support and maintenance subscription. See our IPWorks licensing page for full details.
IPWorks is available to buy in the following products:
전화 : 00798 14 800 6332
팩스 : +1 770 250 6199


