


공식 공급 업체
200 이상의 소프트웨어 개발처와 판매 계약을 맺은 공인 디스트리뷰터로서 합법적인 라이선스를 제공합니다.
모든 브랜드 보기.
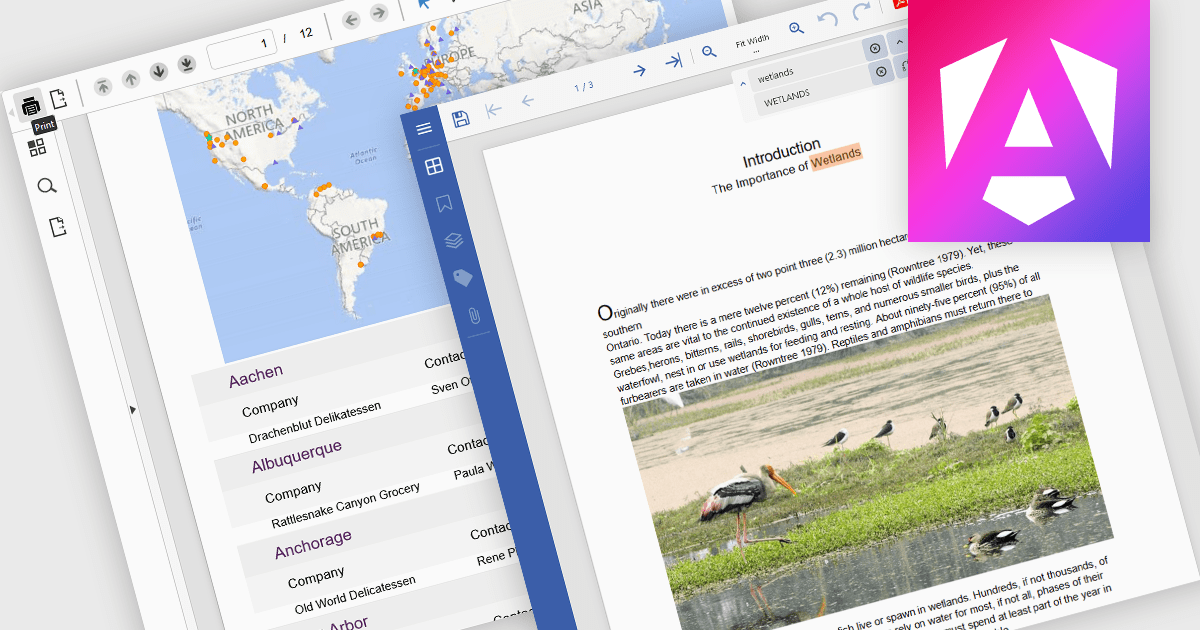
PDF reading and writing capabilities in viewer components are essential for applications that handle document management or display. These features allow developers to integrate PDF interaction directly into web or desktop applications, enabling end-users to open, view, annotate, and sometimes even modify PDF files without relying on external software. By supporting both the consumption and output of PDF content, these components improve workflows across document-heavy environments, such as enterprise reporting, legal systems, and educational platforms.
Common features include:
For an in-depth analysis of features and price, visit our Angular PDF Viewer components comparison.
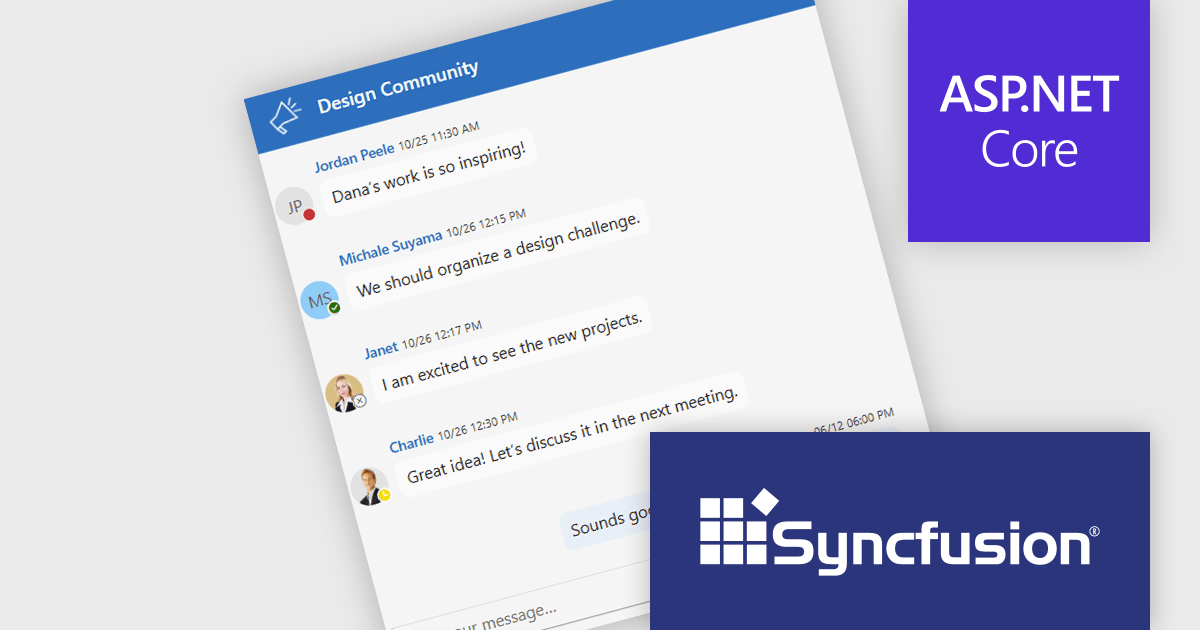
Syncfusion Essential Studio ASP.NET Core (available as part of Syncfusion Essential Studio Enterprise) empowers developers with a comprehensive suite of over 80 UI components specifically designed for building modern and functional web applications. Leveraging the latest advancements in ASP.NET Core, it offers exceptional performance and scalability, improving development by eliminating the need for extensive custom coding. From data visualization tools like interactive charts and grids to sophisticated navigation elements and responsive layouts, Essential Studio equips developers with the building blocks to create rich user experiences, improve application efficiency, and accelerate time-to-market.
The Syncfusion Essential Studio ASP.NET Core 2025 Volume 2 update introduces chat UI status indicators that enhance user presence awareness by displaying real-time availability states such as online, offline, busy, and away. This feature allows developers to build more context-aware chat applications, where users can make informed decisions about when to initiate conversations or manage interactions based on presence.
To see a full list of what's new in 2025 Volume 2 (30.1.37), see our release notes.
Syncfusion Essential Studio ASP.NET Core is available as part of Syncfusion Essential Studio Enterprise which is licensed per developer starting with a Team License of up to five developers. It is available as a 12 Month Timed Subscription License which includes support and maintenance. See our Syncfusion Essential Studio Enterprise licensing page for full details.
Learn more on our Syncfusion Essential Studio ASP.NET Core product page.
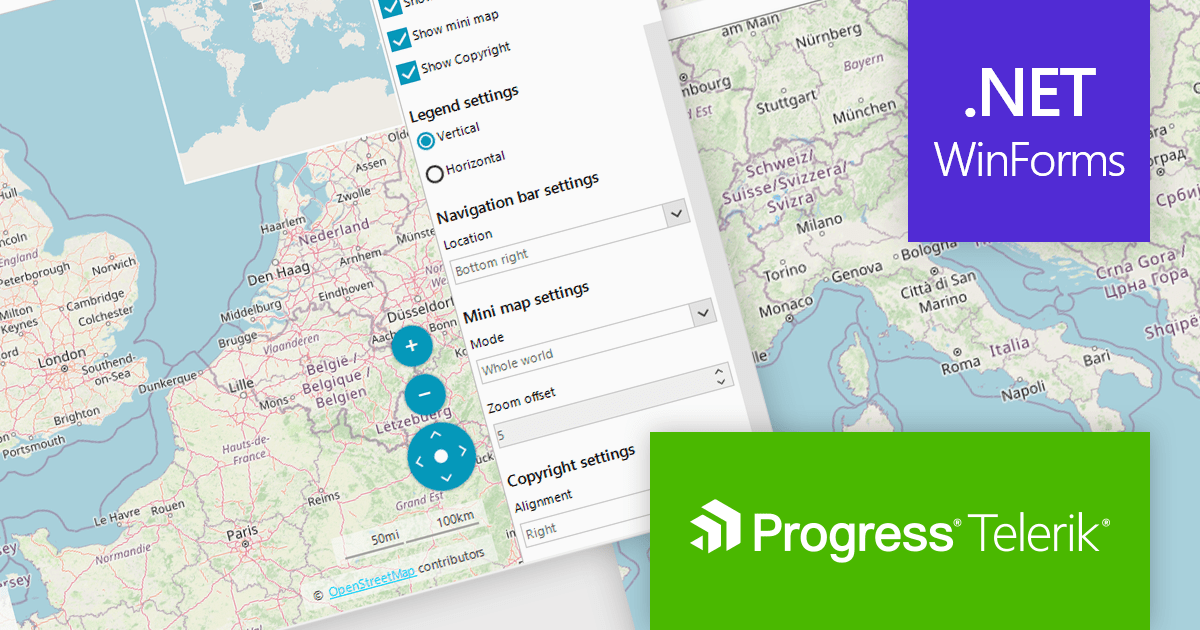
Telerik UI for WinForms is a comprehensive UI library offering over 160 versatile controls designed to streamline the development of modern, data-rich desktop applications. With features like built-in High DPI support, extensive customization options, and components ranging from grids and charts to schedulers and rich text boxes, it empowers developers to craft visually appealing and feature-packed Windows Forms applications.
Telerik UI for WinForms includes a customizable copyright label UI element in the RadMap control. This feature enables the display of information such as source attribution or licensing directly on the map surface. This creates trust and supports legal and ethical use of third-party map providers by making attribution visible to end users. Such support enables compliance with common mapping data usage requirements for commercial applications, which is often mandated by services like OpenStreetMap or Bing Maps. By integrating this element into the visual layer of the map, applications can ensure that attribution remains persistent and clearly associated with the displayed geographic content without requiring additional layout adjustments.
Telerik UI for WinForms is licensed per developer and has two licensing models: an annual Subscription License and a Perpetual License. The Subscription license provides access to the latest product updates, technical support, and exclusive benefits for a flat annual fee, and must be renewed to continue using the software. The Perpetual license is a one-time purchase granting access to the current released version and includes a one-year subscription for product updates and technical support. After this initial period, users can choose to renew the subscription element to continue receiving updates and support; otherwise, they may continue using the installed version available during their active subscription term but will forgo future updates and support. See our Telerik UI for WinForms licensing page for full details.
Telerik UI for WinForms is available individually or as part of the following products:
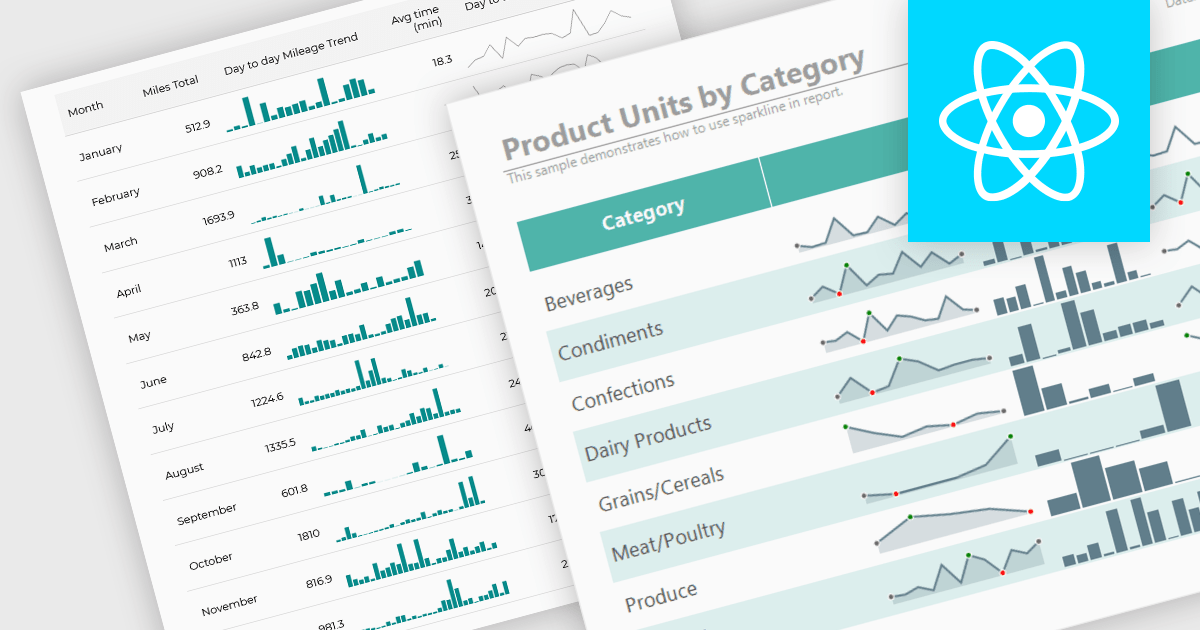
Sparklines are compact, data-rich graphics embedded within reports to illustrate trends, variations, or patterns over time. These miniature charts, typically rendered as lines, columns, or bars, offer a concise visual summary without the need for full-scale graphs. By integrating sparklines directly into data tables or summaries, reporting tools enable users to quickly grasp performance metrics or fluctuations at a glance, enhancing the interpretability of complex datasets.
Several React reporting controls offer sparklines including:
For an in-depth analysis of features and price, visit our React reporting controls comparison.
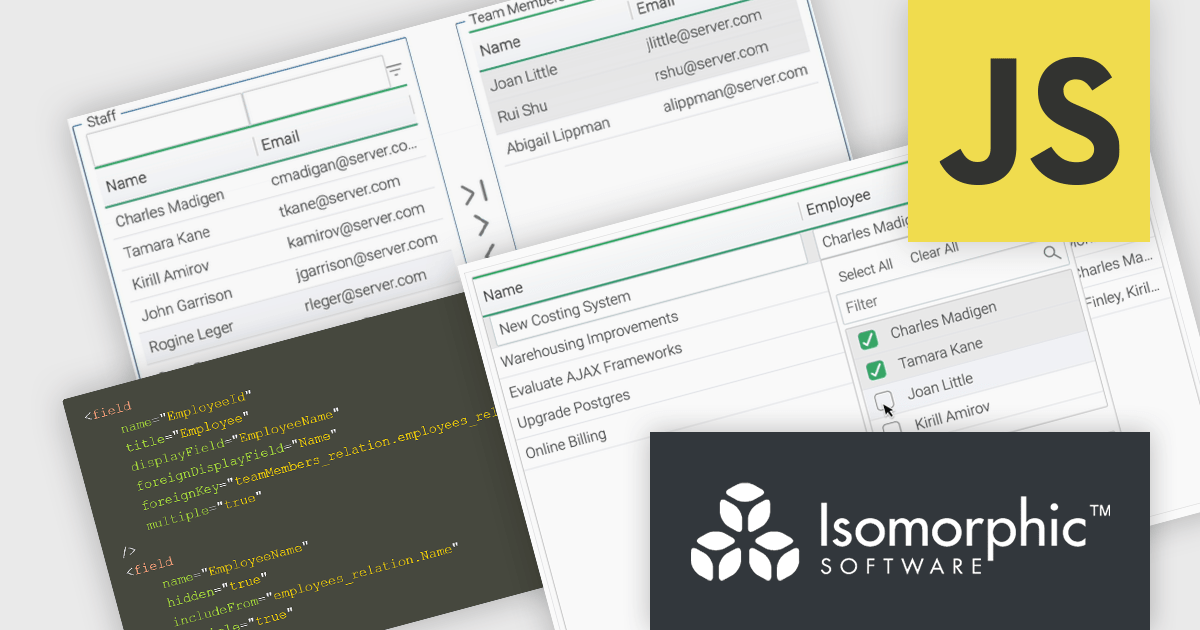
SmartClient is a comprehensive JavaScript component suite compatible with React, Vue, Angular, and more, that allows you to create large-scale, high-productivity web applications. It provides a comprehensive set of tools for developers, including advanced UI components, robust data management capabilities, and integration with modern backend technologies. Key features include dynamic data fetching, customizable grids, and a responsive interface for a wide range of devices. SmartClient enables developers to create applications with optimized performance, scalability, and a superior user experience. Ideal for enterprise-grade use cases, such as financial analytics, inventory management, and real-time reporting, SmartClient empowers organizations to deliver feature-rich applications that handle complex data requirements with ease.
Relations connect objects to each other and are used in databases and systems that are object-oriented. SmartClient lets you declare these relations in your data source using Relation Fields, providing a full access to related data without the need to write additional code. With two new user interface (UI) components for editing related records and the Relation Fields feature, it is now easier to manage many-to-many relationships. "MultiPickerItem" is a compact control used for inline form editing where the selected values appear inline and a pop-up displays checkboxes to enable users to select from a related data source. The Shuttle Interface can be embedded in any layout, including forms and modals, and provides a visual dual-panel interface for handling multi-item associations. These features simplify the management of relational data, offering users a declarative, scalable, and user-friendly approach.
SmartClient is licensed per developer and is available as both perpetual and subscription licenses. Product updates and technical support is also available. See our SmartClient licensing page for full details.
For more information, visit our SmartClient product page.
전화 : 00798 14 800 6332
팩스 : +1 770 250 6199


