


공식 공급 업체
200 이상의 소프트웨어 개발처와 판매 계약을 맺은 공인 디스트리뷰터로서 합법적인 라이선스를 제공합니다.
모든 브랜드 보기.
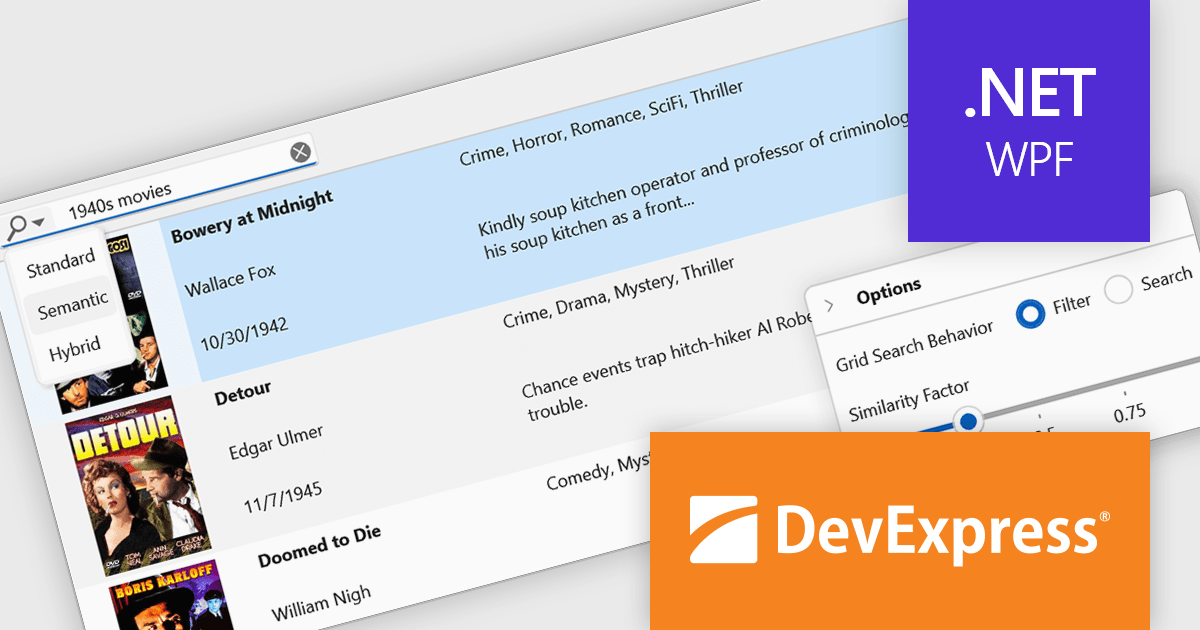
DevExpress WPF is a powerful suite of controls that enhances your WPF development toolkit. It offers data grids, ribbon menus, rich text editors, spreadsheets, charts, and more – all with beautiful themes and touch-friendly interfaces. DevExpress WPF empowers you to build professional-looking, responsive applications that meet modern user expectations, saving you time and effort while adding polish and functionality.
The DevExpress WPF v25.1 update introduces a new semantic search capability for the Data Grid that leverages Natural Language Processing (NLP). Rather than depending solely on exact keyword matches, it converts user input into vector representations. These representations are then analyzed through a similarity algorithm, allowing the system to identify and rank results based on contextual meaning. This update significantly improves the quality of search results, especially in datasets where users may phrase queries in varied or imprecise ways. It’s particularly beneficial in applications that deal with complex or user-generated content, offering developers a more natural and adaptive search mechanism.
To see a full list of what's new in version 25.1, see our release notes.
DevExpress WPF is licensed per developer and is available as a Perpetual License with a 12 month support and maintenance subscription. We can supply new subscriptions, subscription renewals, and additional licenses. See our DevExpress WPF licensing page for full details.
DevExpress WPF is available to buy in the following products:
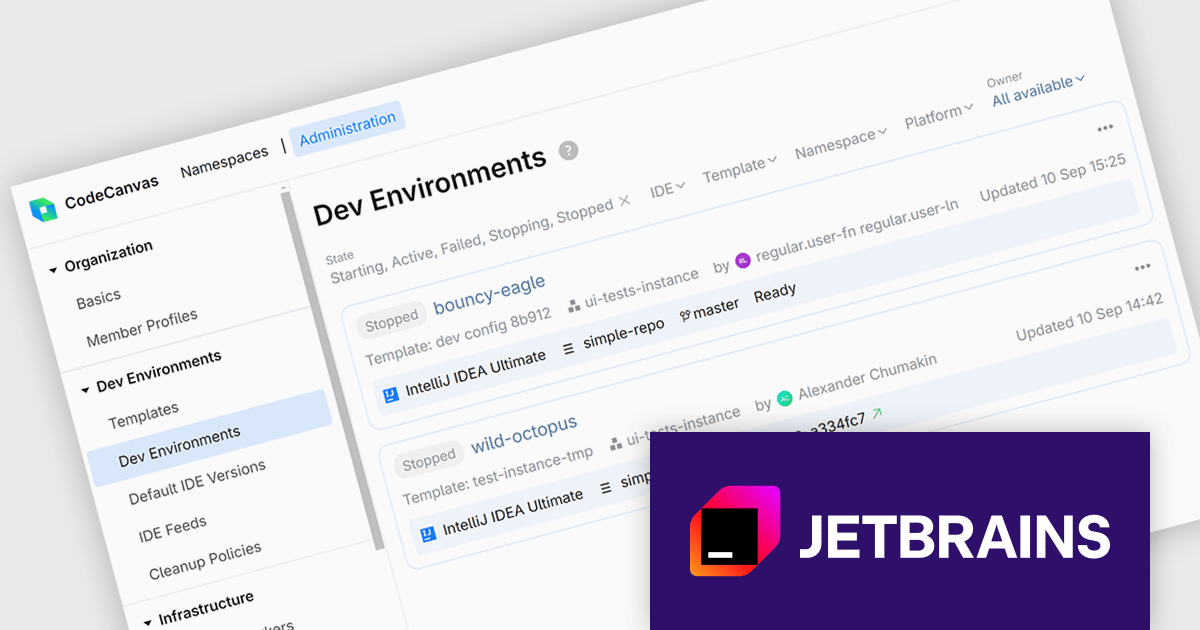
CodeCanvas is JetBrains’ answer to the growing need for scalable, cloud-based development setups that don’t compromise on control or tooling preferences. As a cloud development environment (CDE) orchestrator, it allows teams to spin up consistent and fully configured development environments using their favorite JetBrains IDEs - all within their own infrastructure. This setup significantly reduces the overhead of environment mismatches and local setup time, making it easier for developers to start writing code immediately, no matter where they’re working from.
For development teams managing large or distributed projects, CodeCanvas offers a practical path to improving development speed and reliability. It ensures every developer gets access to the same tools, configurations, and system resources from day one, reducing time spent on debugging environment issues. Since everything runs in the cloud - yet remains under your control - it’s also easier to enforce security standards, manage updates, and scale resources to fit your needs. CodeCanvas is particularly well-suited for teams looking to standardize their tooling without giving up the IDEs they’re already comfortable with.
CodeCanvas is available as an annual subscription license. It uses a floating license model governed by Daily Active Users (DAU). Any user can access CodeCanvas as long as the number of users active on any single day does not exceed the total licenses purchased. The license pool resets every 24 hours, enabling different team members to rotate access. See our CodeCanvas licensing page for full details.
For more information, see our CodeCanvas product page.
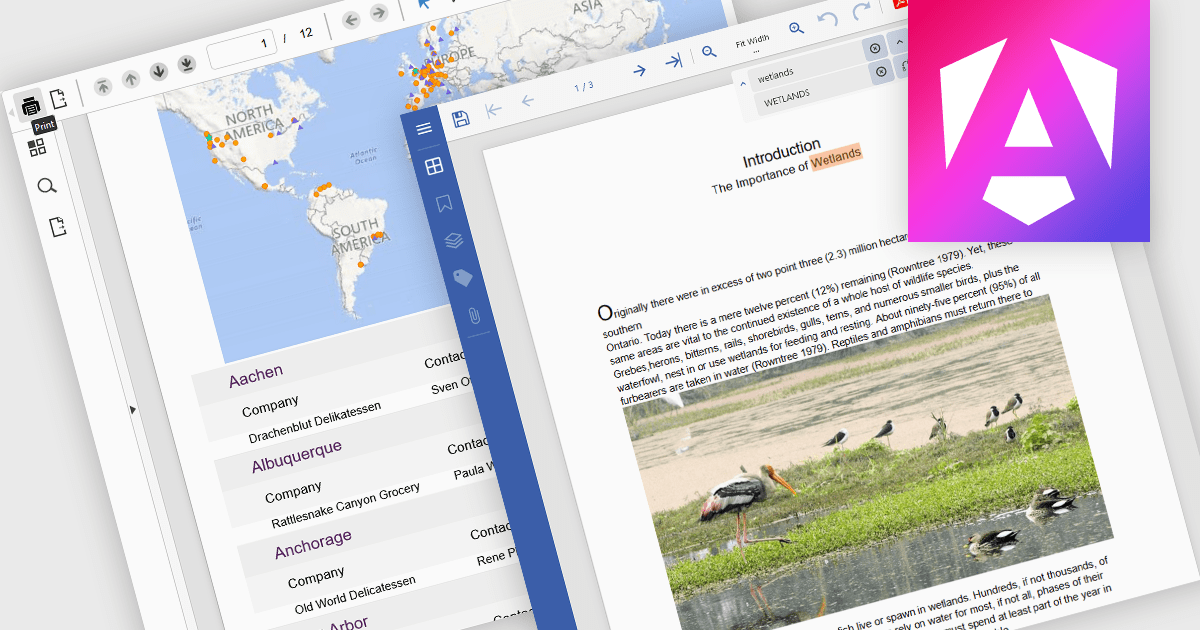
PDF reading and writing capabilities in viewer components are essential for applications that handle document management or display. These features allow developers to integrate PDF interaction directly into web or desktop applications, enabling end-users to open, view, annotate, and sometimes even modify PDF files without relying on external software. By supporting both the consumption and output of PDF content, these components improve workflows across document-heavy environments, such as enterprise reporting, legal systems, and educational platforms.
Common features include:
For an in-depth analysis of features and price, visit our Angular PDF Viewer components comparison.
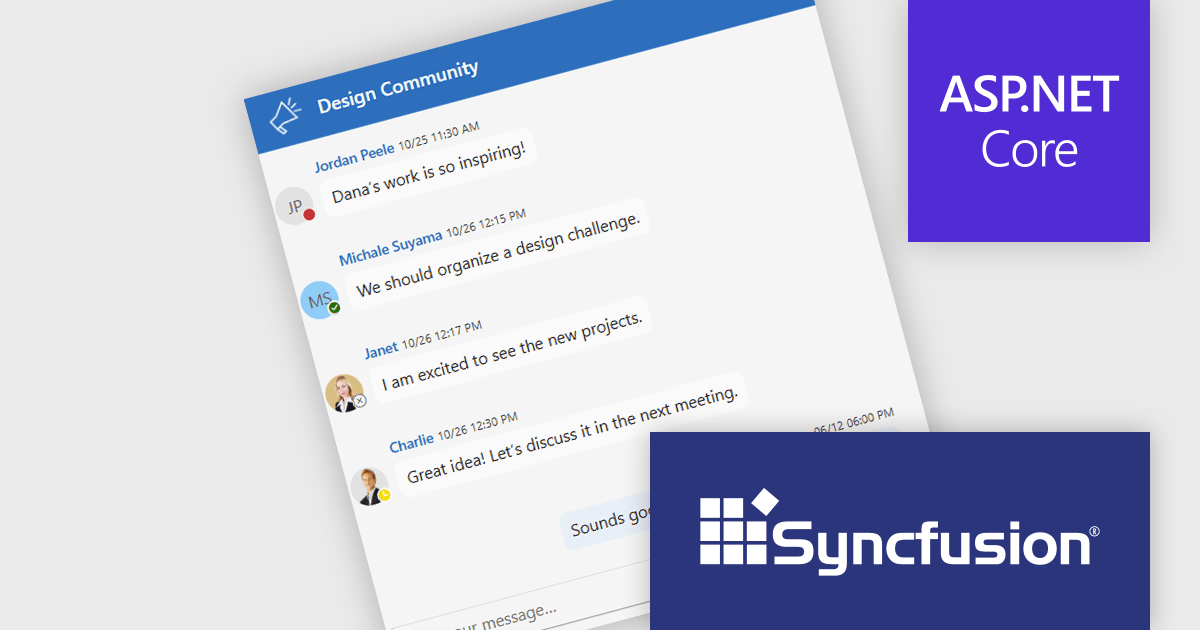
Syncfusion Essential Studio ASP.NET Core (available as part of Syncfusion Essential Studio Enterprise) empowers developers with a comprehensive suite of over 80 UI components specifically designed for building modern and functional web applications. Leveraging the latest advancements in ASP.NET Core, it offers exceptional performance and scalability, improving development by eliminating the need for extensive custom coding. From data visualization tools like interactive charts and grids to sophisticated navigation elements and responsive layouts, Essential Studio equips developers with the building blocks to create rich user experiences, improve application efficiency, and accelerate time-to-market.
The Syncfusion Essential Studio ASP.NET Core 2025 Volume 2 update introduces chat UI status indicators that enhance user presence awareness by displaying real-time availability states such as online, offline, busy, and away. This feature allows developers to build more context-aware chat applications, where users can make informed decisions about when to initiate conversations or manage interactions based on presence.
To see a full list of what's new in 2025 Volume 2 (30.1.37), see our release notes.
Syncfusion Essential Studio ASP.NET Core is available as part of Syncfusion Essential Studio Enterprise which is licensed per developer starting with a Team License of up to five developers. It is available as a 12 Month Timed Subscription License which includes support and maintenance. See our Syncfusion Essential Studio Enterprise licensing page for full details.
Learn more on our Syncfusion Essential Studio ASP.NET Core product page.
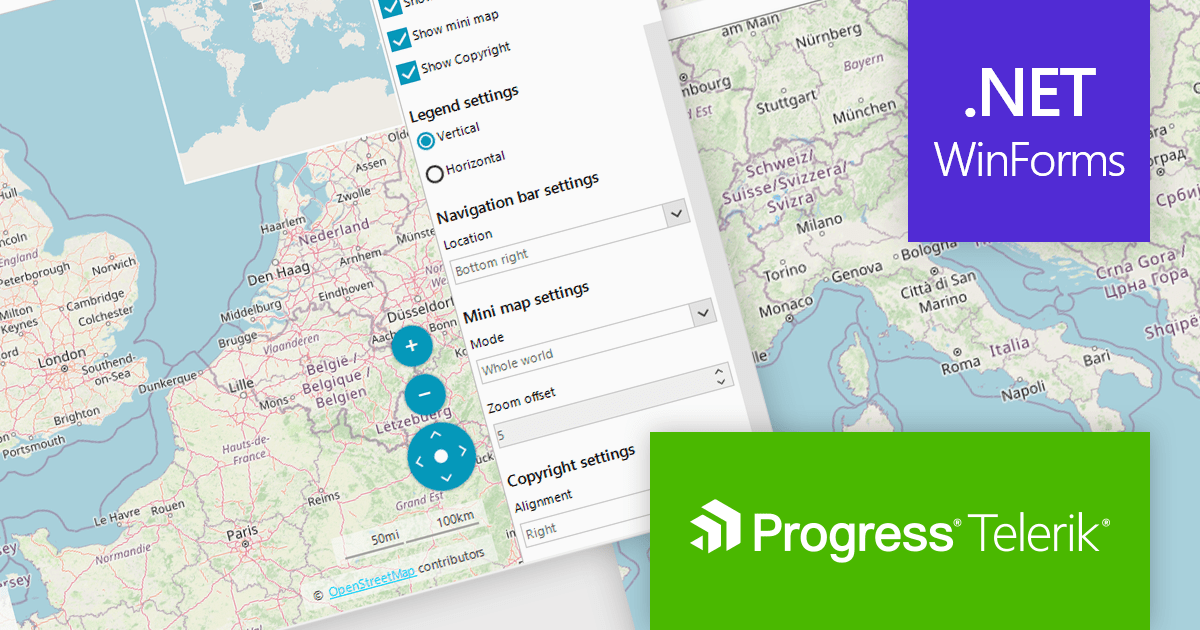
Telerik UI for WinForms is a comprehensive UI library offering over 160 versatile controls designed to streamline the development of modern, data-rich desktop applications. With features like built-in High DPI support, extensive customization options, and components ranging from grids and charts to schedulers and rich text boxes, it empowers developers to craft visually appealing and feature-packed Windows Forms applications.
Telerik UI for WinForms includes a customizable copyright label UI element in the RadMap control. This feature enables the display of information such as source attribution or licensing directly on the map surface. This creates trust and supports legal and ethical use of third-party map providers by making attribution visible to end users. Such support enables compliance with common mapping data usage requirements for commercial applications, which is often mandated by services like OpenStreetMap or Bing Maps. By integrating this element into the visual layer of the map, applications can ensure that attribution remains persistent and clearly associated with the displayed geographic content without requiring additional layout adjustments.
Telerik UI for WinForms is licensed per developer and has two licensing models: an annual Subscription License and a Perpetual License. The Subscription license provides access to the latest product updates, technical support, and exclusive benefits for a flat annual fee, and must be renewed to continue using the software. The Perpetual license is a one-time purchase granting access to the current released version and includes a one-year subscription for product updates and technical support. After this initial period, users can choose to renew the subscription element to continue receiving updates and support; otherwise, they may continue using the installed version available during their active subscription term but will forgo future updates and support. See our Telerik UI for WinForms licensing page for full details.
Telerik UI for WinForms is available individually or as part of the following products:
전화 : 00798 14 800 6332
팩스 : +1 770 250 6199


