


공식 공급 업체
200 이상의 소프트웨어 개발처와 판매 계약을 맺은 공인 디스트리뷰터로서 합법적인 라이선스를 제공합니다.
모든 브랜드 보기.
Syncfusion Essential Studio Blazor (available as part of Syncfusion Essential Studio Enterprise) is a comprehensive UI component library designed to accelerate the development of high-performance, modern web applications using the Blazor framework. It boasts over 85+ responsive, lightweight, and modular components spanning various categories such as data visualization, data editing, document processing, and interactive UI elements. This rich repertoire empowers developers to rapidly build user-friendly, feature-rich web interfaces, with seamless integration of both server-side and client-side Blazor applications.
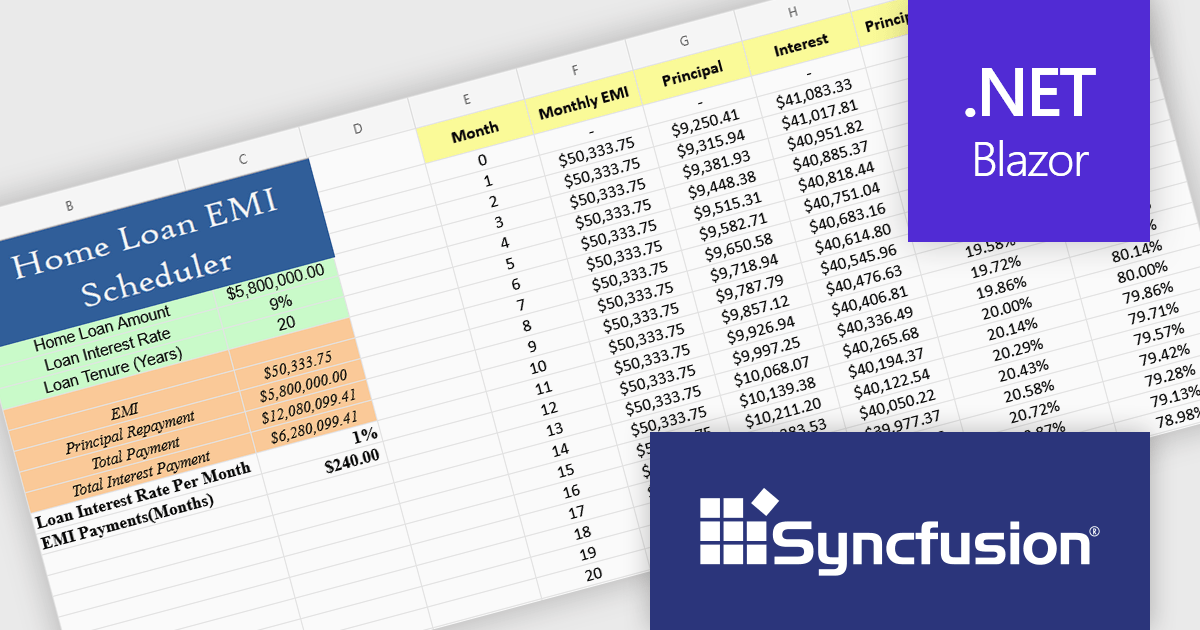
The Syncfusion Essential Studio Blazor 2025 Volume 2 update introduces a new Spreadsheet control (in preview) that provides developers with an Excel-like environment for web applications, enabling efficient data manipulation, formula-based calculations, and file operations. This control supports core spreadsheet functionality such as cell editing, formatting, sorting, and selection, while also allowing for interactive features like dynamic resizing, autofill, image insertion, and hyperlink support. Designed with performance and scalability in mind, the Spreadsheet control helps developers manage complex data scenarios and deliver responsive, user-friendly interfaces within their Blazor applications.
To see a full list of what's new in 2025 Volume 2, see our release notes.
Syncfusion Essential Studio Blazor is available as part of Syncfusion Essential Studio Enterprise which is licensed per developer starting with a Team License of up to five developers. It is available as a 12 Month Timed Subscription License which includes support and maintenance. See our Syncfusion Essential Studio Enterprise licensing page for full details.
Learn more on our Syncfusion Essential Studio Blazor product page.
Highcharts Dashboards by Highsoft is a comprehensive platform tailored for software developers seeking efficient data visualization solutions. It offers a robust toolkit for creating interactive dashboards and charts, leveraging the Highcharts library renowned for its flexibility and performance. With support for various data formats and extensive customization options, developers can seamlessly integrate dynamic visualizations into their applications. Highsoft's dashboards empower developers to convey complex data insights effectively, enhancing user experience and decision-making capabilities within their software projects.
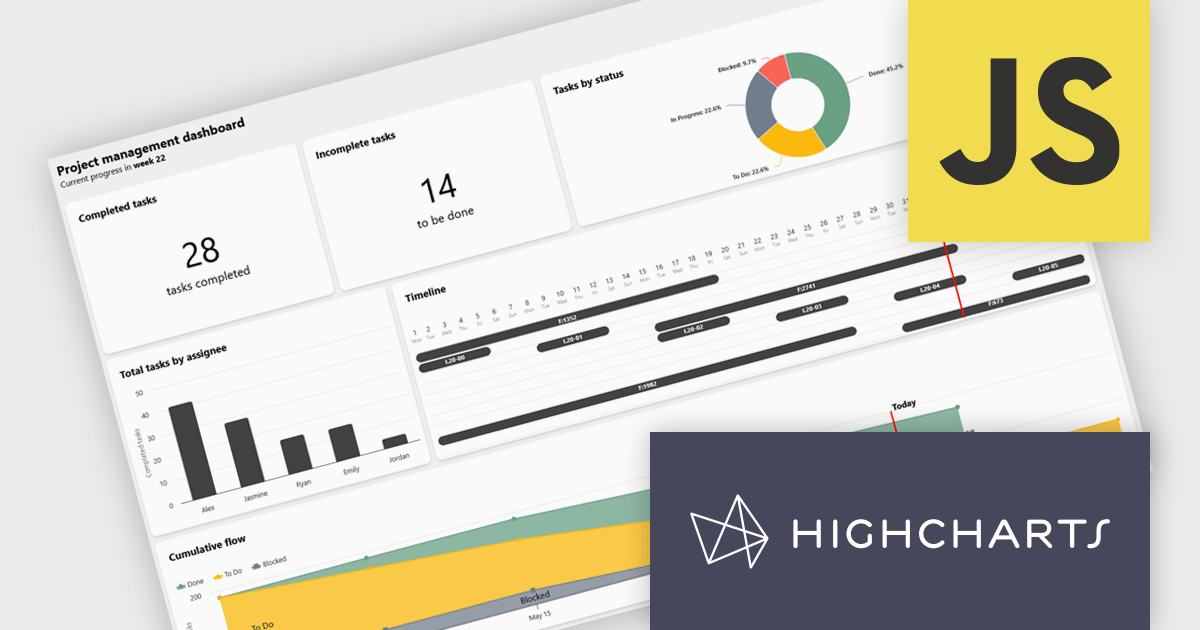
Highcharts Dashboards offers a Project Management dashboard that gives users a real-time view of project progress, team workload, and milestones. By consolidating key metrics into an interactive interface, it improves tracking, resource planning, and timeline management. Users can assess deliverable status, identify task dependencies, and align team capacity with project goals. Visual tools like Gantt charts and status overviews improve communication, reduce misalignment, and support more informed decision-making across both agile and traditional workflows.
Highcharts Dashboards is licensed per developer as an Annual or Perpetual License with Internal, Saas, SaaS+ and OEM distribution options. The annual license includes support and all product updates for 1 year and must be renewed to continue to use the software. The perpetual license includes an "Advantage Subscription" for 1 to 5 years which provides support and updates for that period. If you do not renew Advantage then you may continue to use the software at the last release available during the active Advantage period. See our Highcharts Dashboards licensing page for full details.
Learn more on our Highcharts Dashboards product page.
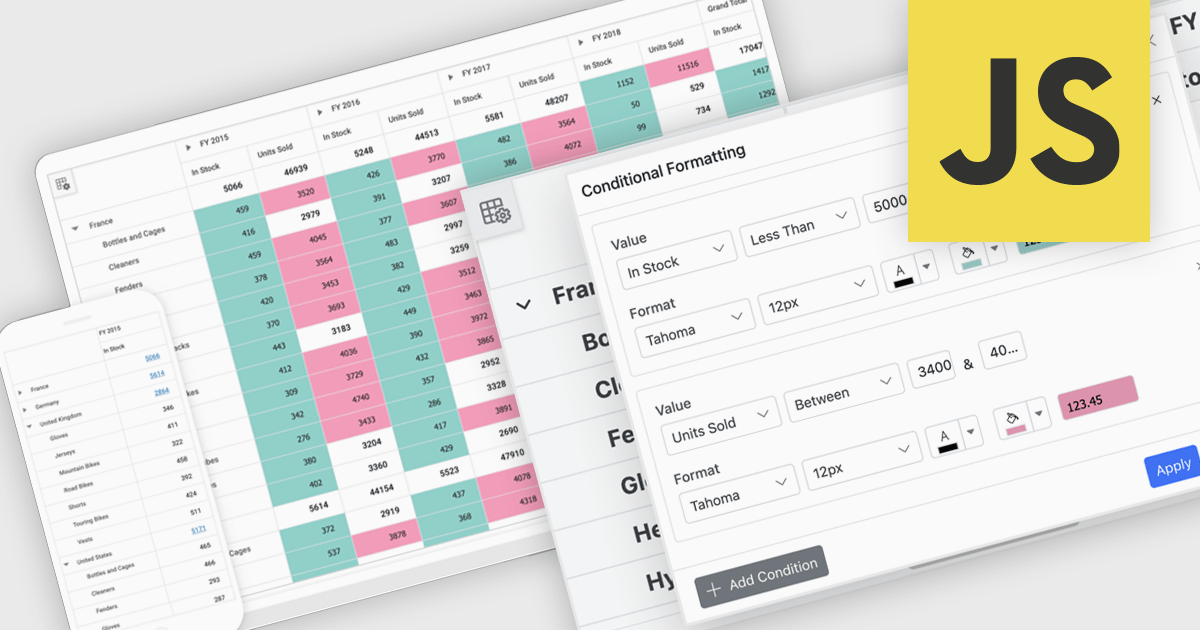
A pivot grid is a powerful data analysis tool that lets users quickly organize and summarize large datasets by rearranging rows, columns, and values. It simplifies reporting by allowing users to group, filter, and aggregate data to uncover patterns and trends. Pivot tables improve clarity, reduce manual calculations, and support flexible data exploration. Common use cases include analyzing sales by product or region, tracking departmental budgets, and creating summary reports for decision making.
Several JavaScript UI suites offer pivot grid components including:
For an in-depth analysis of features and price, visit our comparison of JavaScript UI suites.
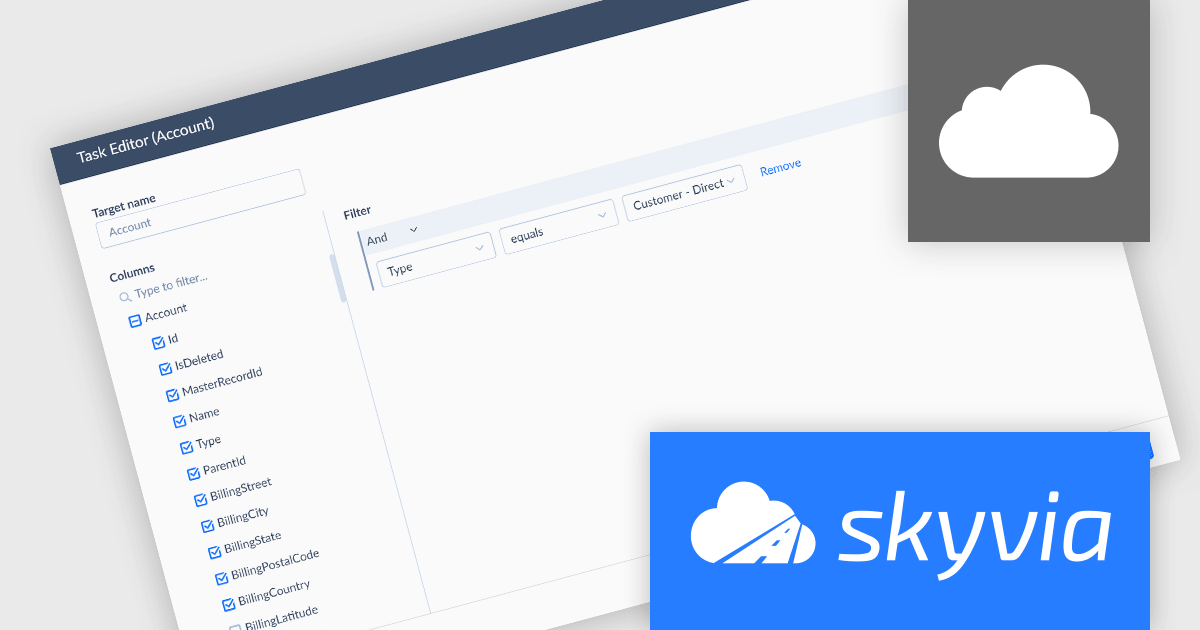
Skyvia Data Integration is a cloud-based platform that provides a unified environment for managing data pipelines, ETL processes, and data synchronization between various data sources and destinations. It offers a low-code interface for creating and configuring data integration workflows, automating routine tasks, and ensuring data consistency across different systems. The platform supports a wide range of data formats and protocols, including relational databases, MySQL databases, cloud storage, and APIs, making it a versatile tool for data professionals and developers.
The latest Skyvia Data Integration release adds support for replicating data from PostgreSQL, enabling efficient synchronization with cloud storage or databases. This allows users to create consistent, up-to-date copies of their PostgreSQL data in cloud warehouses or other systems for analytics, backup, or reporting purposes. By automating replication tasks, businesses can ensure data consistency across platforms while reducing manual effort and potential for error.
To see a full list of what's new, see our release notes.
Skyvia Data Integration is licensed based on the number of records processed per month and is available as an Annual License. See our Skyvia Data Integration licensing page for full details.
Learn more on our Skyvia Data Integration product page.
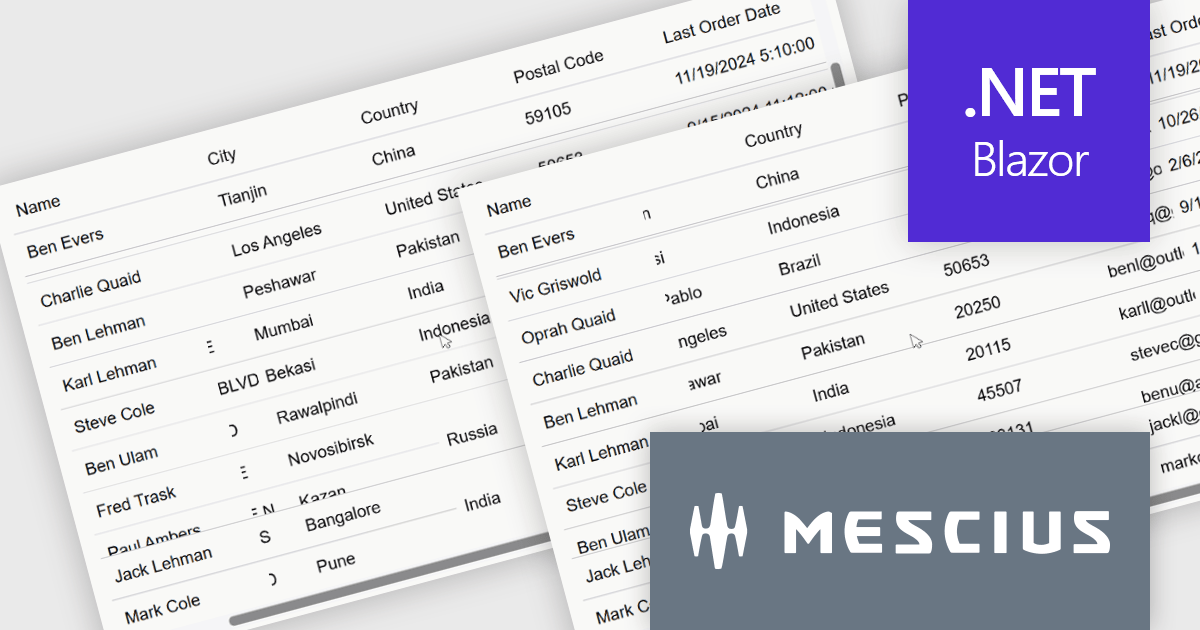
ComponentOne Studio Blazor Edition by MESCIUS allows developers to leverage their existing C# skills to build rich web applications. This comprehensive suite includes high-performance, native Blazor UI controls like FlexGrid, a powerful datagrid with data virtualization, and 50+ chart types for data visualization. It also offers essential input controls like Autocomplete and Combobox, improving development efficiency and creating a seamless experience for both developers and users.
The ComponentOne Studio Blazor Edition 2025 v1 update introduces support for freezing columns to the right and rows to the bottom in FlexGrid, giving developers greater control over data presentation in complex UI scenarios. This enhancement allows critical data such as totals or summary rows and columns to remain visible as users scroll through the grid, improving usability and reducing the need for redundant navigation. It aligns with common spreadsheet behavior and enables developers to deliver a more intuitive and efficient user experience within their Blazor applications.
To see a full list of what's new in 2025 v1, see our release notes.
ComponentOne Studio Blazor Edition is licensed per developer on a perpetual basis and includes a 12 month subscription. See our ComponentOne Studio Blazor Edition licensing page for full details.
ComponentOne Studio Blazor Edition is available individually or as part of ComponentOne Studio Enterprise.
전화 : 00798 14 800 6332
팩스 : +1 770 250 6199


