


Fornecedor oficial
Como distribuidores oficiais e autorizados, nós fornecemos licenças legítimas diretamente de mais de 200 editores de software.
Ver todas as nossas marcas.
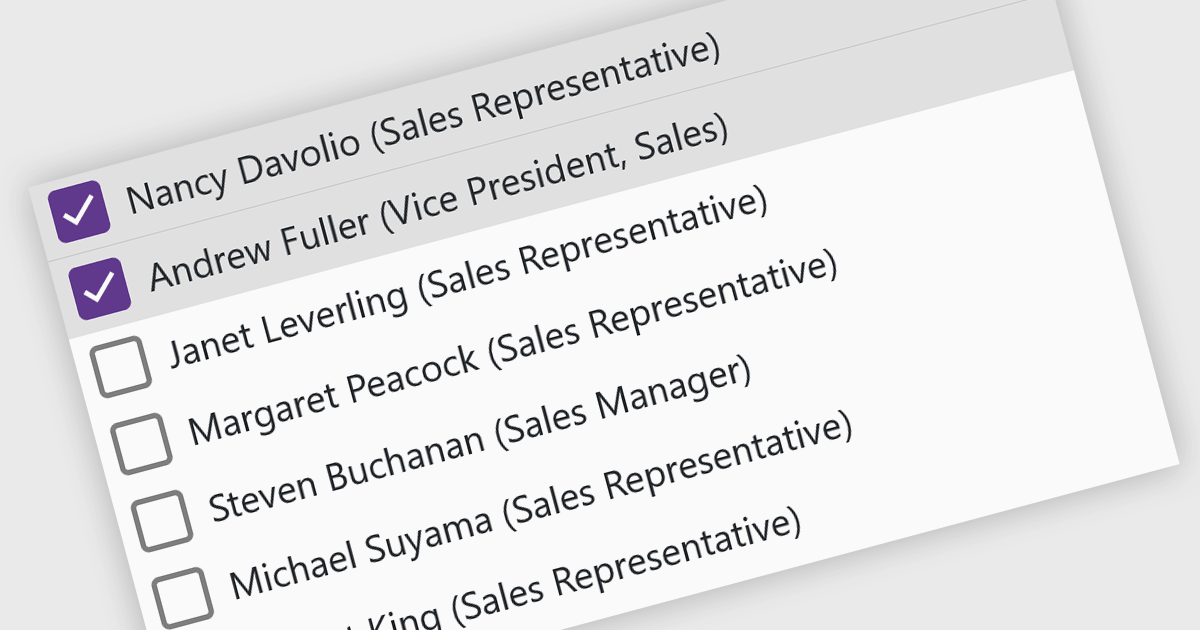
A checked listbox is a graphical user interface element that combines a listbox with checkboxes. It presents a list of options, similar to a standard listbox, but allows users to select multiple items by clicking on an adjacent checkbox for each option. This is useful for scenarios where users need to choose from various choices, but not be limited to a single selection.
Several Blazor data editor collections offer checked listboxes including:
For an in-depth analysis of features and price, visit our Blazor Data Editors comparison.
Aspose.Finance for Python via .NET is a library that lets you interact with financial data formats like XBRL, iXBRL, and OFX within your Python programs. By leveraging the .NET framework, it provides a powerful and user-friendly API for tasks like creating, reading, editing, and validating these financial documents, ultimately enhancing your Python applications' ability to handle financial data.
The Aspose.Finance for Python via .NET 24.3 release adds support for converting OFX Request and Response Document output to PDF. Creating human-readable PDF representations of OFX data lets users easily share and archive financial information without relying on specialized software or technical knowledge. This improves collaboration, streamlines document management, and simplifies record-keeping processes.
To see a full list of what's new in 24.3, see our release notes.
Aspose.Finance for Python via .NET is offered as Developer Small Business, Developer OEM, Site Small Business, and Site OEM licenses catering to a range of business needs. Licenses are perpetual, and include 1 year of support and maintenance. Subscription renewals are also available. See our Aspose.Finance for Python via .NET licensing page for full details.
Aspose.Finance for Python via .NET is available in the following products:
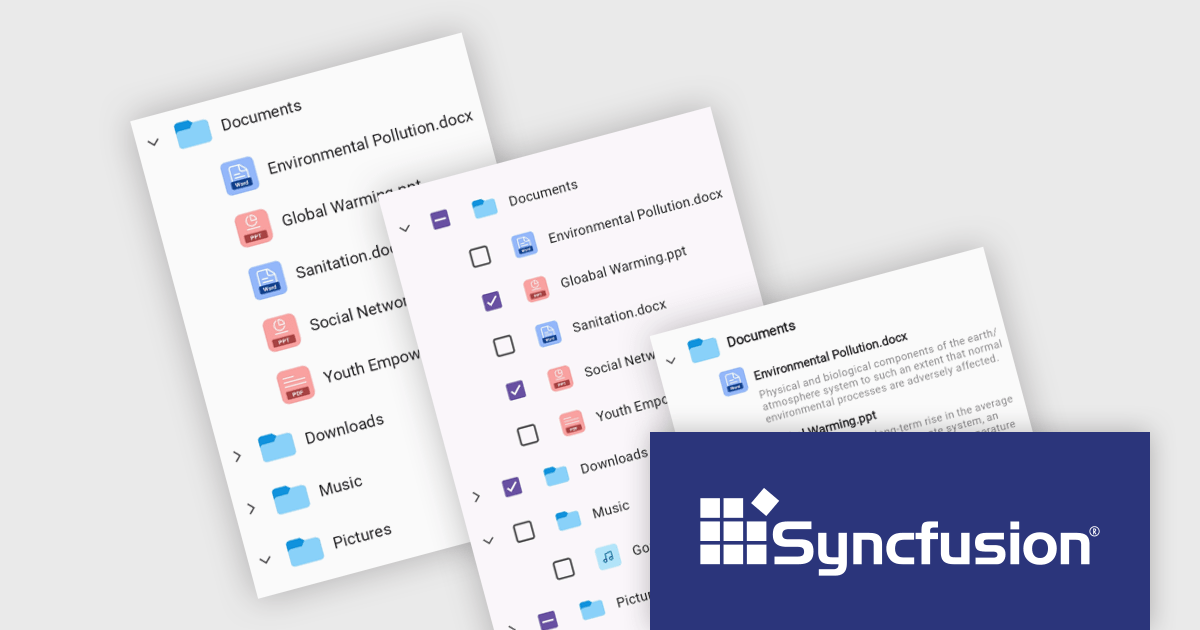
Syncfusion Essential Studio .NET MAUI, available as part of Syncfusion Essential Studio Enterprise, empowers developers with a comprehensive suite of native UI controls, data visualization tools, and performance optimizations for building modern, cross-platform mobile and desktop applications. This professional-grade toolkit leverages the power of C# and XAML, enabling rapid development of stunning and responsive experiences across diverse platforms.
The Syncfusion Essential Studio .NET MAUI 2024 Volume 1 (25.1.35) release introduces the production-ready TreeView component which is designed to display hierarchical data in a familiar tree-like structure. It allows users to expand and collapse branches, ensuring efficient navigation through complex information. Optimized for smooth scrolling and data reuse, the TreeView supports data binding for easy population and offers customization options for both UI appearance and selection behavior.
To see a full list of what's new in version 2024 Volume 1 (25.1.35), see our release notes.
Syncfusion Essential Studio .NET MAUI is available as part of Syncfusion Essential Studio Enterprise which is licensed per developer starting with a Team License of up to five developers. It is available as a 12 Month Timed Subscription License which includes support and maintenance. See our Syncfusion Essential Studio Enterprise licensing page for full details.
For more information, visit our Syncfusion Essential Studio .NET MAUI product page.
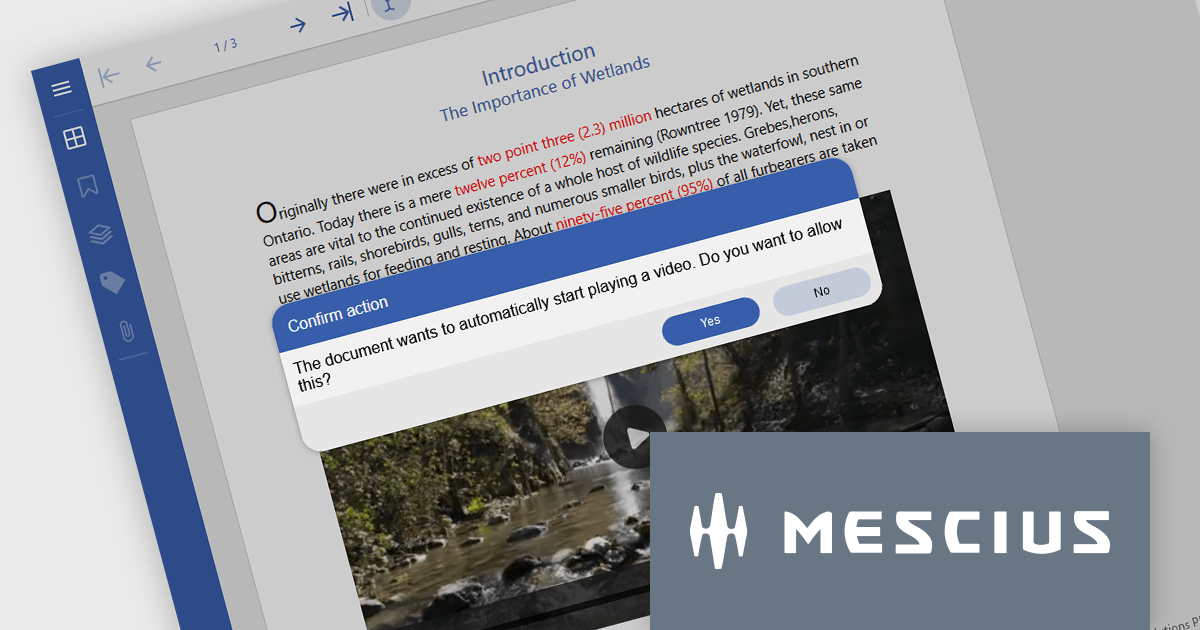
Document Solutions for PDF (DsPdf) by MESCIUS is a software development toolkit that provides .NET Core libraries and a JavaScript PDF viewer for manipulating and displaying PDFs. DsPdf enables developers to create, edit, annotate, and redact PDF documents directly within web applications. The included DsPdfViewer component offers a feature-rich, cross-platform solution for viewing and interacting with PDFs in modern browsers on various operating systems, including mobile devices.
The Document Solutions for PDF (DsPdf) v7.1 update introduces support for Rich Media, enabling developers to embed and interact with multimedia content directly within PDFs. This functionality expands the capabilities of DsPdf beyond traditional text and image manipulation, allowing for the creation of more engaging and interactive PDF documents. Developers can now integrate audio, video, and other multimedia elements into their PDFs, enhancing the user experience and providing new avenues for content creation.
To see a full list of what's new in 7.1, see our release notes.
Document Solutions for PDF is licensed per developer and is available in several license options for differing distribution needs. Team licenses are also available for multiple developers within the same organization. See our Document Solutions for PDF licensing page for full details.
Learn more on our Document Solutions for PDF product page.
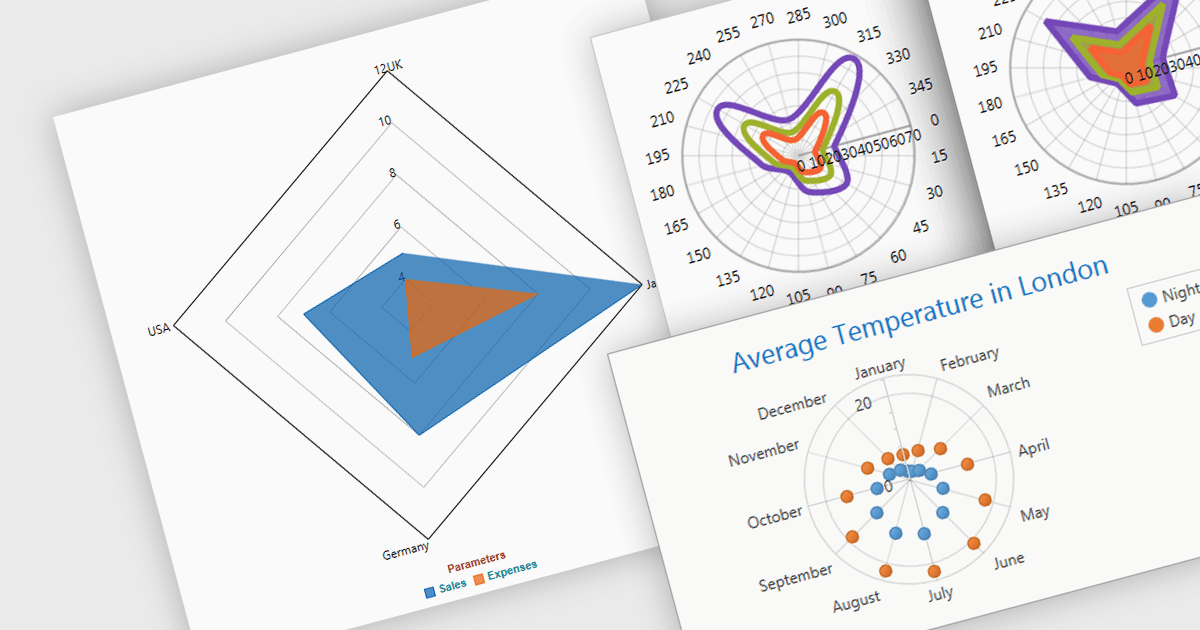
Radar and polar charts are both visualizations for displaying multiple data Radar charts specifically connect the data points to form a web-like shape, highlighting relative strengths and weaknesses across categories. Polar charts focus on the angular relationship between data points. Both are ideal for comparing sets of data with several variables, making them valuable tools in fields like performance analysis, where strengths and weaknesses across different metrics need to be understood.
Several WPF chart components support radar and polar charts, including:
For an in-depth analysis of features and price, visit our comparison of WPF chart components.
Tel: (888) 850 9911
Fax: +1 770 250 6199


