













官方供应商
我们作为官方授权经销商,直接提供超过200家开发厂家所发行超过1000个的产品授权给您。
查看我们的所有品牌。
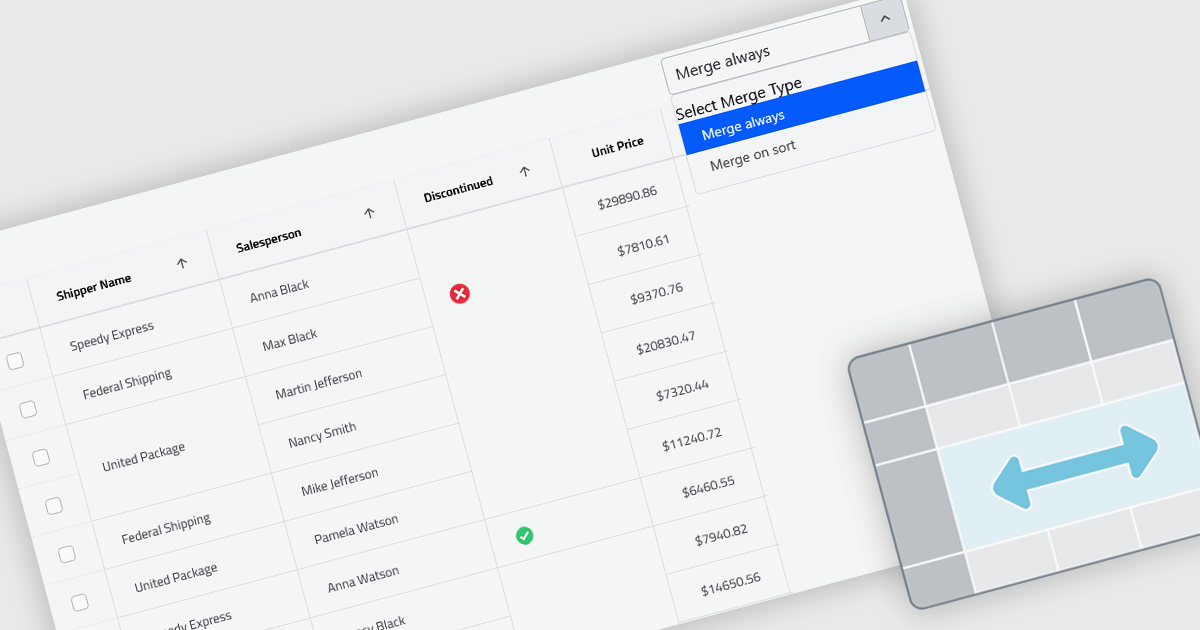
Cell merging in grids combines adjacent cells with matching or conditionally defined values into a single cell, typically within a column. This reduces repetitive data and creates cleaner, more readable tables that are easier to scan and understand. By visually grouping related rows, it helps highlight patterns and relationships in large datasets. The feature can be applied automatically or customized, making it useful for scenarios such as financial reports, schedules, and inventory lists where repeated values can be consolidated for better clarity.
Several React grid controls offer cell merge support including:
For an in-depth analysis of features and price, visit our React grid controls comparison.
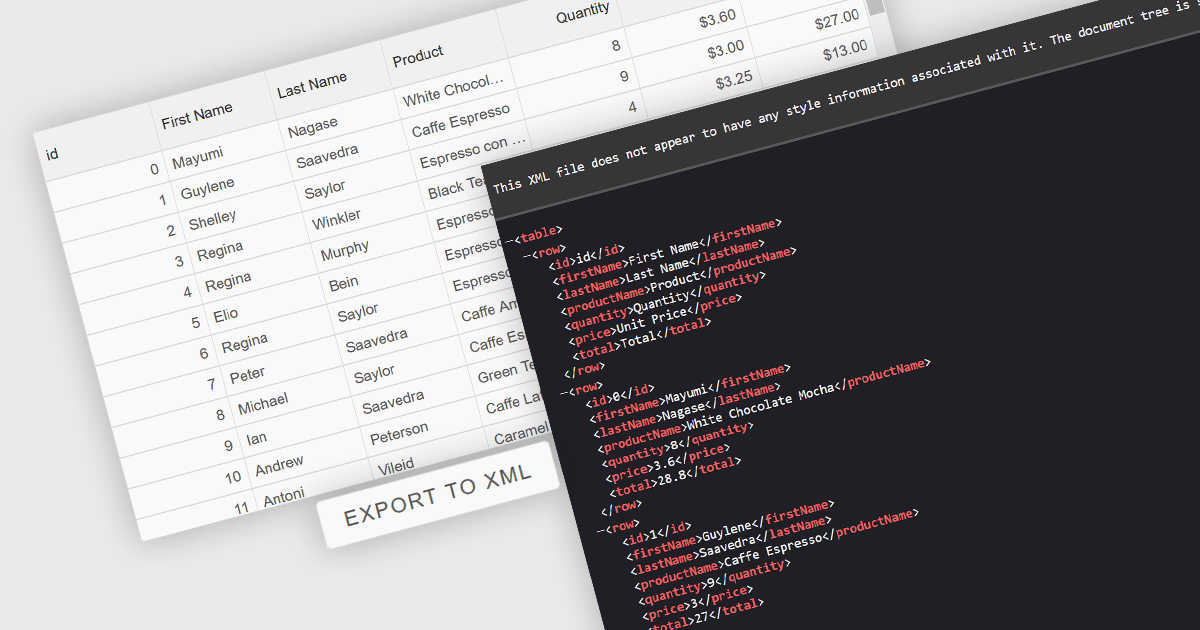
Exporting grid data to XML converts tabular data from a user interface grid into a structured, self-describing format for use beyond the application interface. By organizing data with clearly defined elements, XML ensures consistent interpretation across platforms and systems, regardless of the underlying technology. This enables reliable data exchange, supports interoperability between applications, and makes the data suitable for integration scenarios, long-term storage, and environments that rely on validated, standardized formats for processing and communication.
Several Angular grid components allow you to export to XML, including:
For an in-depth analysis of features and price, visit our comparison of Angular grid components.
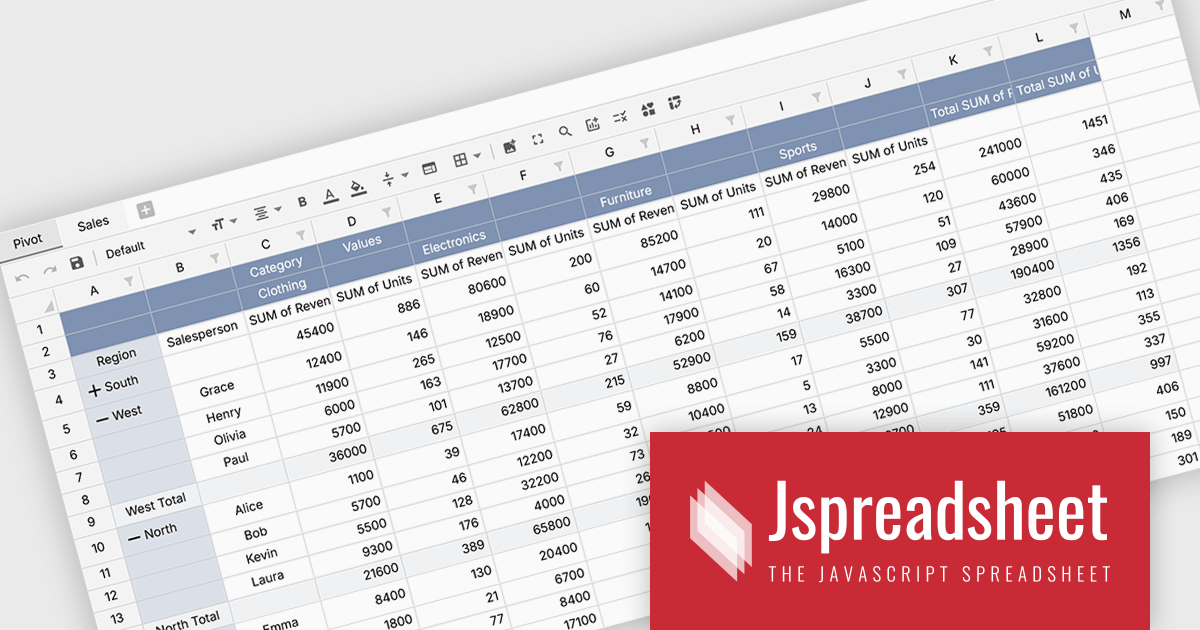
Jspreadsheet Pro is a flexible JavaScript-based spreadsheet solution that enables developers to create customizable, feature-rich data grids for web applications. It offers advanced formulas, data validation, and API integrations. Ideal for tasks like financial modeling, inventory management, and project tracking, it helps businesses efficiently manage and analyze data.
Jspreadsheet Pro introduces pivot table functionality that allows developers to summarize and analyze large datasets directly within browser based spreadsheet applications. It enables users to group data across multiple rows and columns, apply aggregation methods such as sum or average, and refine results through filtering and sorting. With built in spreadsheet formulas and cross worksheet references, developers can provide interactive data analysis capabilities without requiring external tools or additional backend processing.
Jspreadsheet Pro is licensed as an Annual or a Perpetual License with support and maintenance. We can supply any Jspreadsheet Pro license including new licenses, maintenance renewals, and upgrade licenses. See our Jspreadsheet Pro for full details.
For more information, visit our Jspreadsheet Pro product page.

Handsontable is a JavaScript library designed to help developers build interactive data grids into their web applications. Offering a familiar spreadsheet-like interface, it allows users to edit, sort, and filter data with ease. Highly customizable and compatible with popular frameworks like React and Angular, Handsontable empowers developers to build robust data manipulation features into their web applications.
The Handsontable 17.0.0 update adds a new MultiSelect cell type that allows a single cell to hold multiple values, making it well suited for data such as tags, user roles, product categories, or shipment contents. Instead of restricting entries to one option, users can choose any number of items from a dropdown interface that includes search and filtering capabilities for quickly locating options. Full keyboard navigation ensures efficient interaction for power users.
To see a full list of what's new in version 17.0.0, see our release notes.
Handsontable is licensed per developer and is available as an Annual or Perpetual license with 1 year support and maintenance. See our Handsontable licensing page for full details.
For more information, visit our Handsontable product page.
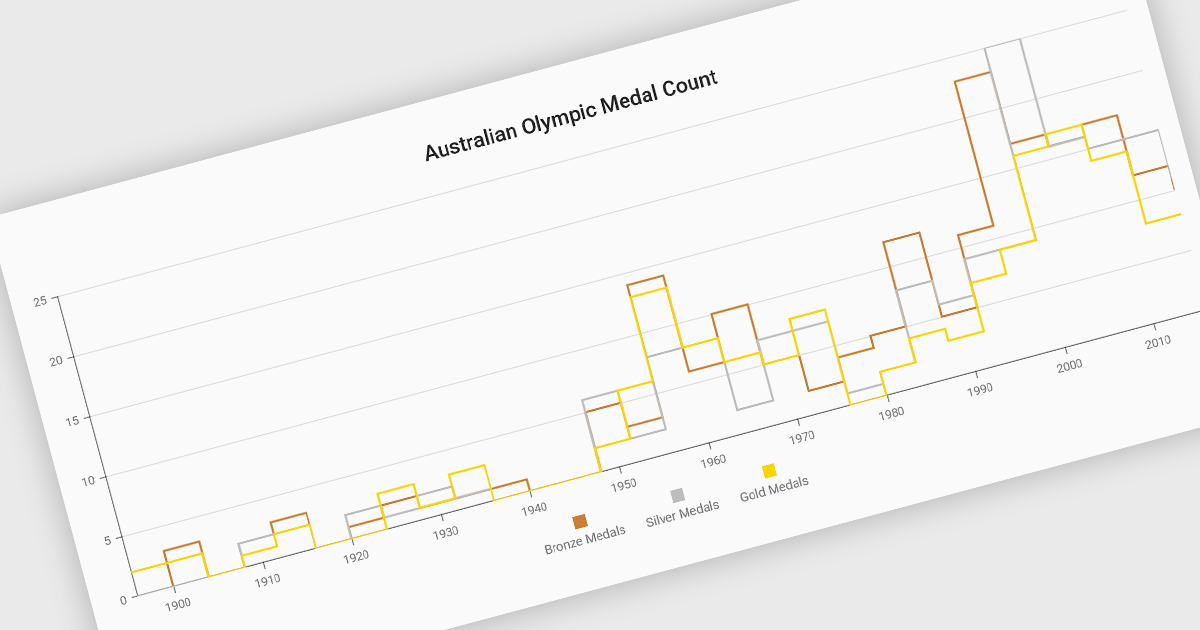
Step line charts are a variation of line charts that display changes between data points as a series of horizontal and vertical segments rather than diagonal lines. This structure highlights discrete transitions between values, making it easier to show when a change occurs and how long a value remains constant before the next update. Step line charts are useful for representing processes where values shift at specific moments, such as pricing tiers, system states, or configuration thresholds. By clearly separating periods of stability from points of change, the chart type helps developers and analysts interpret state-based or event-driven data with greater precision.
Several Vue.js chart components support the step line chart type, including:
For an in-depth analysis of features and price, visit our comparison of Vue.js charting components.
联系电话: (888) 850 9911
传真: +1 770 250 6199


