


官方供应商
我们作为官方授权经销商,直接提供超过200家开发厂家所发行超过1000个的产品授权给您。
查看我们的所有品牌。

DevExpress and ComponentSource have worked together for 25 years, building a long-standing partnership focused on providing professional developer tools. DevExpress is known for its extensive range of UI controls, reporting tools, dashboards, and application frameworks across platforms including .NET, JavaScript, Blazor, WinForms, WPF, and ASP.NET. Together, the two companies support development teams creating desktop, web, and mobile applications.
At the center of this collaboration is DevExpress Universal, a flagship product available through ComponentSource, giving developers access to the full suite of DevExpress UI controls, reporting, and testing tools in a single subscription. This comprehensive offering helps teams standardize on one vendor while covering multiple platforms and project requirements.
This long-term partnership strengthens ComponentSource’s product portfolio by including one of the most widely used developer toolsets in the industry. It also enables ComponentSource to deliver DevExpress products to customers worldwide, supported by international sales teams, local currencies, and licensing expertise that simplify the purchasing process for organizations across different regions.
Learn more about DevExpress.

Using JSON (JavaScript Object Notation) as a data source for charts allows applications to bind structured, lightweight data directly to visualization components. JSON represents data as objects and arrays, making it well suited to defining categories, series, and individual data points in a format that aligns naturally with modern web development practices. Its widespread use in RESTful APIs and web services enables charts to consume live or remote datasets efficiently, while reducing the need for complex data transformation before rendering.
Several Vue.js chart components allow you to use JSON as a data source, including:
For an in-depth analysis of features and price, visit our comparison of Vue.js charting components.
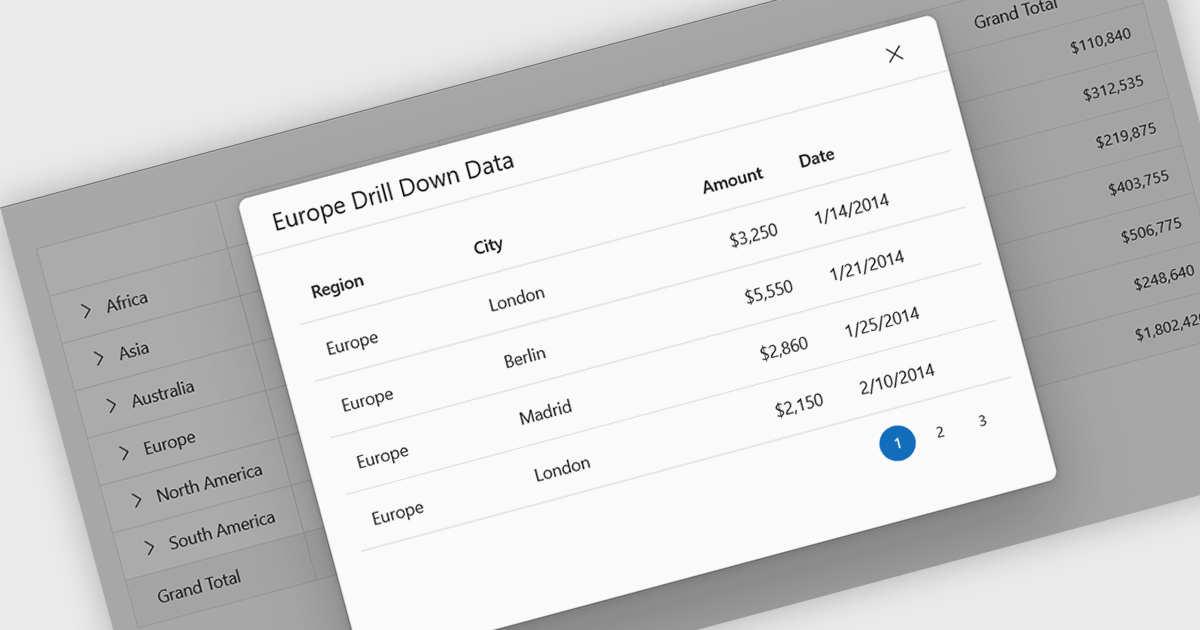
Drill-down support in a grid component allows users to move from summarized data to more detailed records within the same interface, often by expanding rows or selecting linked values that reveal related data. Instead of navigating to a separate page or view, users can access underlying information directly in context. For developers, this reduces the need for additional navigation and simplifies the presentation of hierarchical or related datasets. It also makes it easier to analyze data step by step, helping users inspect specific records or relationships without losing their place in the overall dataset.
Several React grid controls support drill-down features including:
For an in-depth analysis of features and price, visit our React grid controls comparison.
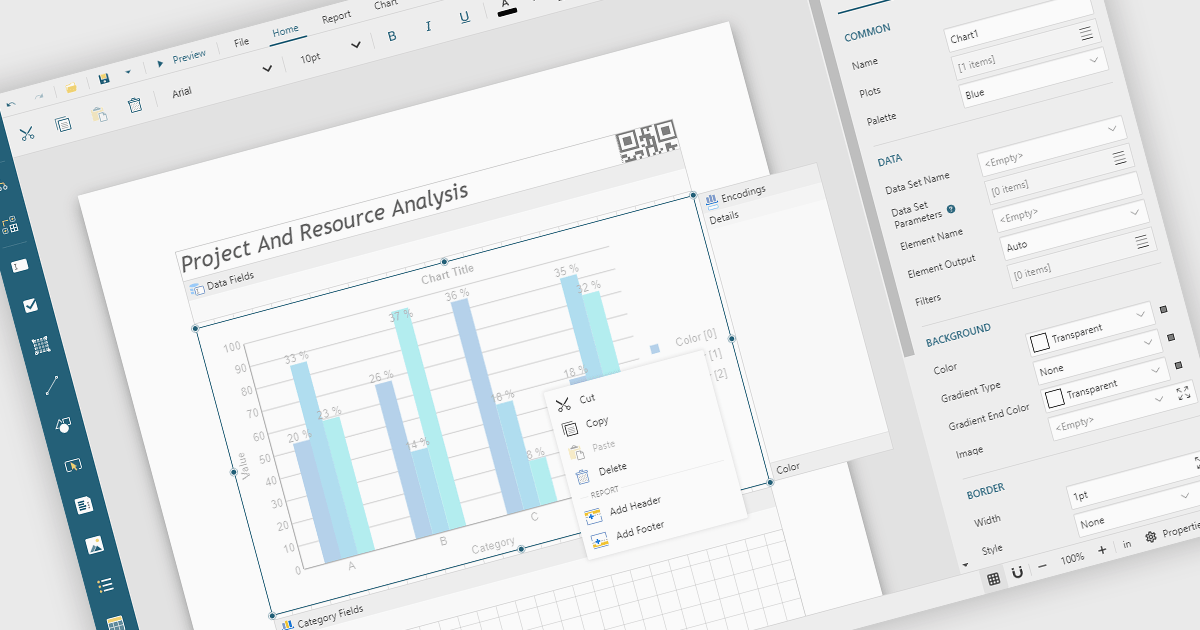
A Visual Report Designer is an application that enables users to create interactive, analytical, and print-ready reports using an intuitive, drag-and-drop interface. It supports fully customizable templates and data visualization components, helping teams present complex information clearly while maintaining consistent branding and layouts. Typical use cases include executive dashboards, financial and operational reports, customer analytics summaries, compliance documents, and branded client-facing reports.
Several JavaScript reporting components offer visual report designers including:
For an in-depth analysis of features and price, visit our JavaScript reporting comparison.
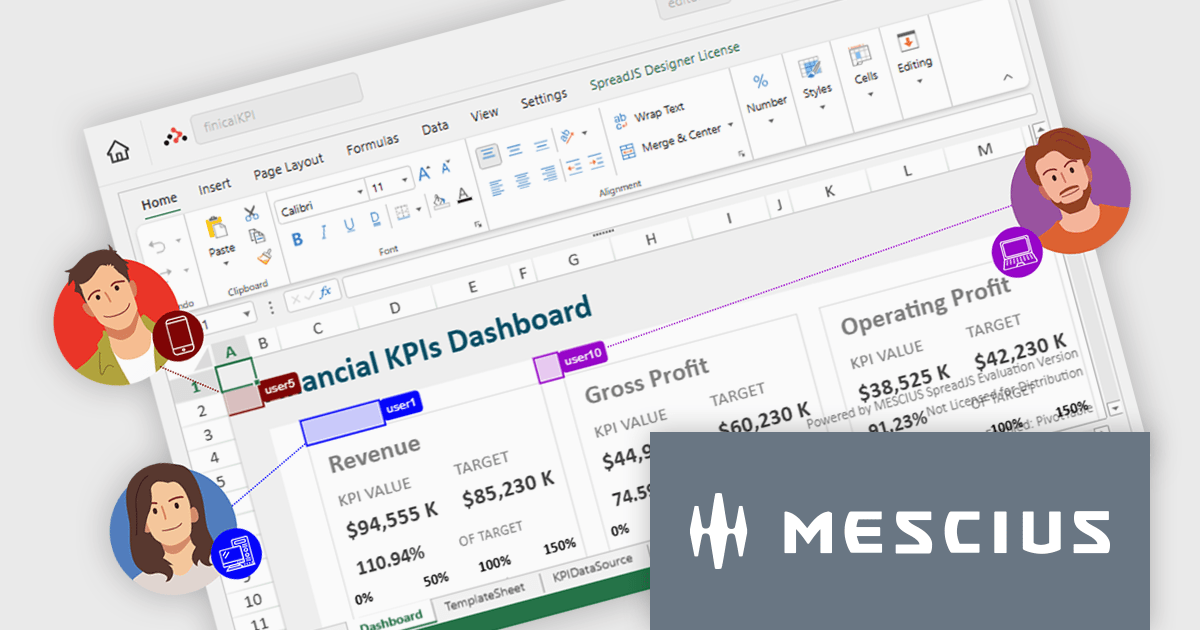
SpreadJS is a complete enterprise JavaScript spreadsheet solution used to create financial reports and dashboards, budgeting and forecasting models, scientific, engineering, healthcare, education, science lab notebooks, and other similar JavaScript business applications. It leverages a high-speed calculation engine with over 500 Excel built-in functions in 19 languages to deliver true Excel-like spreadsheet experiences with zero dependencies on Excel and full support for React, Vue, Angular, and TypeScript.
On Thursday, February 26th at 11:00 AM EST, MESCIUS (formerly GrapeCity) will be presenting a CodeClinic Live Webinar highlighting the new Collaboration Server as a production-ready solution for real-time, multi-user spreadsheet editing in enterprise JavaScript applications. During this webinar, SpreadJS Product Manager Chris Bannon and Product Marketing Manager Mackenzie Albitz will take you through the following key takeaways:
Register for the Live Webinar today and mark your calendar for February 26th.
SpreadJS is licensed per developer and includes 1 Year Maintenance (major and minor version releases and unlimited support phone calls). SpreadJS requires an Annual or Perpetual Deployment License. The optional Add-ons are available at an additional cost, and require a SpreadJS license. See our SpreadJS licensing page for full details.
For more information, visit our SpreadJS product page.
联系电话: (888) 850 9911
传真: +1 770 250 6199


