













官方供应商
我们作为官方授权经销商,直接提供超过200家开发厂家所发行超过1000个的产品授权给您。
查看我们的所有品牌。
TX Text Control .NET Server for ASP.NET is a server side component for Web applications, or services. It is a fully programmable ASP.NET word processor engine that offers an extensive palette of word processing features. Using TX Text Control .NET Server, programmers can develop server side, end user applications that generate documents on-the-fly, using data from databases, binary files (Microsoft Word DOC and DOCX), ASCII files (XML, RTF, HTML) and image data (JPG, PNG, BMP, TIF, GIF, WMF). Documents can be created, modified and edited in a browser or printed in batch processes.
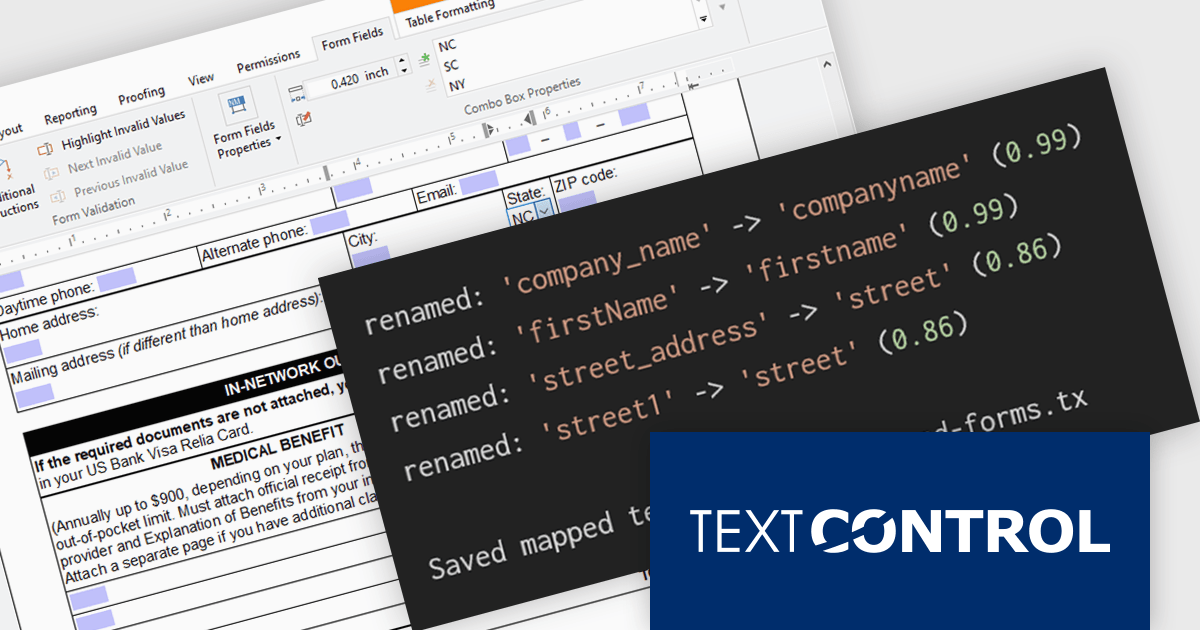
In this blog post from Text Control, Bjoern Meyer demonstrates how to automatically map TX Text Control form fields to JSON data in a .NET C# application, even when the names are not an exact match. It uses fuzzy matching and is especially useful in cases where templates and data sources evolve independently. The included sample project takes you through the following steps:
Read the complete blog and learn how to automatically prepare templates for JSOPN-based document workflows.
TX Text Control .NET Server for ASP.NET is licensed per developer and is available as a Perpetual License with a 12 month support and maintenance subscription. Run time licenses are required for the deployment to production servers. See our TX Text Control .NET Server for ASP.NET licensing page for full details.
For more information, visit our TX Text Control .NET Server for ASP.NET product page.
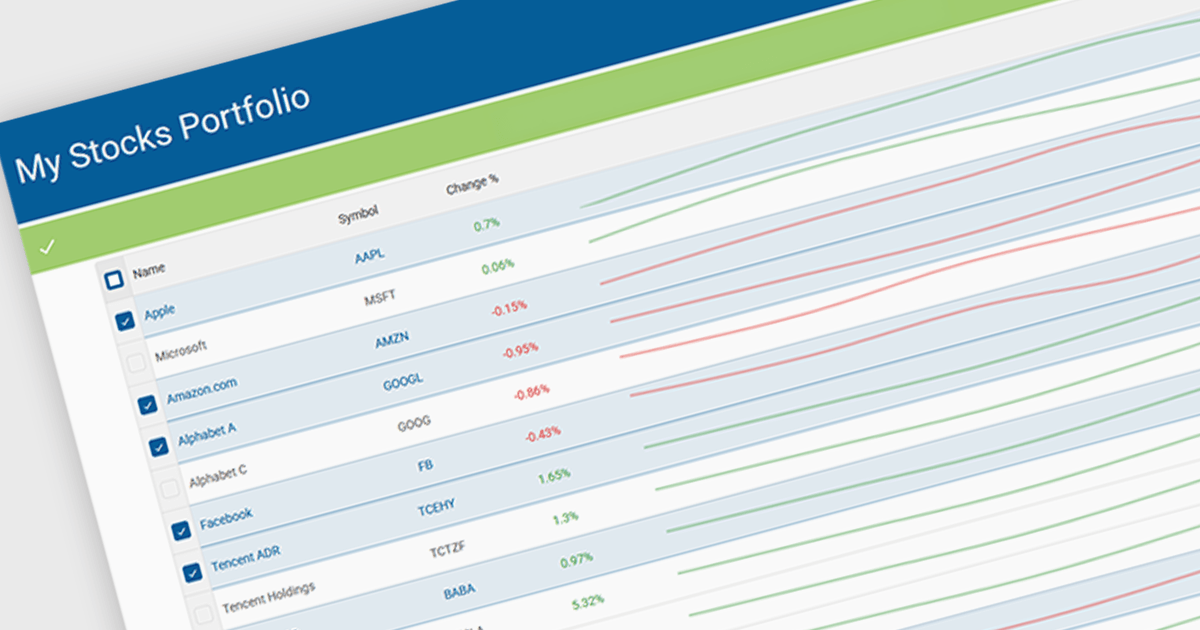
Sparklines in grids display compact visual charts directly inside grid cells, making it easier to identify trends, patterns, and performance without leaving the table view. By transforming raw data into clear visual insights, they help users analyze information faster, reduce dashboard clutter, and make more informed decisions. Common use cases include tracking stock performance in financial applications, monitoring sales and revenue trends in business dashboards, and highlighting operational KPIs in enterprise reporting systems.
Several JavaScript grid controls offer support for sparklines including:
For an in-depth analysis of features and price, visit our JavaScript Grid controls comparison.
ActiveReportsJS by MESCIUS is a JavaScript reporting toolkit that allows developers to design and embed interactive reports within web applications. It includes a standalone report designer for building reports visually and a JavaScript report viewer component that integrates with web frameworks such as React or vanilla JavaScript. The toolkit supports a range of data visualization options and export formats, helping developers deliver rich, interactive reporting capabilities in the browser.
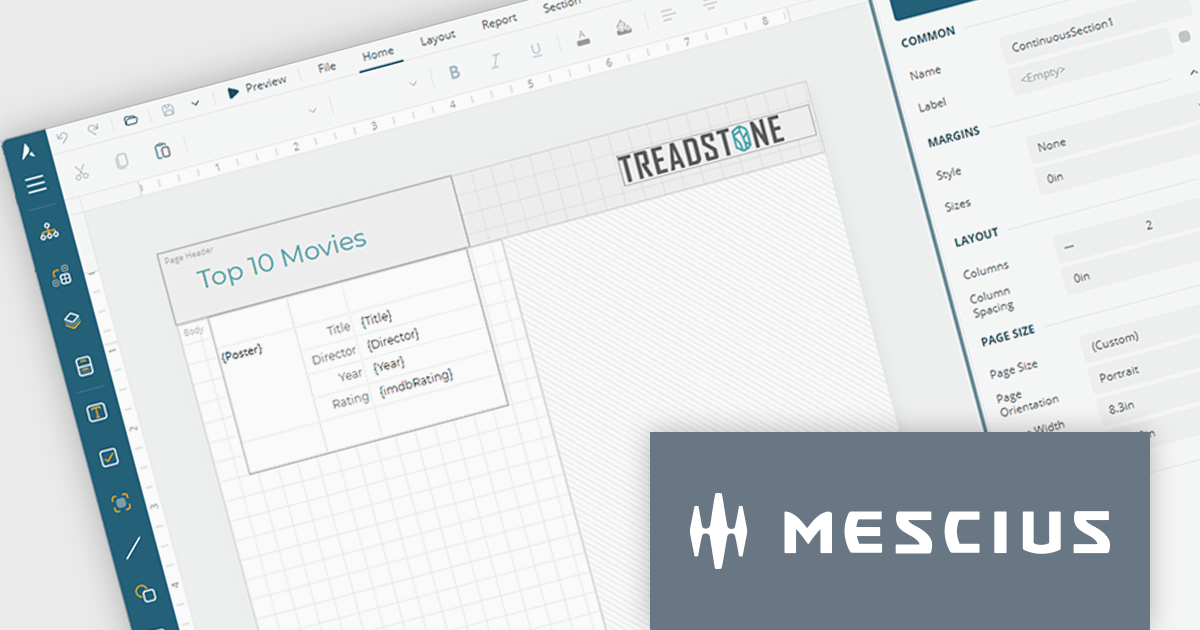
The ActiveReportsJS Report Designer now offers a more intuitive design-time experience for multi-column reports. Column splits are displayed directly on the design surface, providing clear visual guidance when creating report layouts. To help maintain layout accuracy, controls can be placed in the primary column while additional columns are automatically generated at runtime as content grows. This approach makes it easier to design, preview and manage multi-column reports while reducing the risk of unexpected layout issues.
To see a full list of what's new in 6.1, see our release notes.
ActiveReportsJS is licensed on an annual subscription or perpetual basis and is available as a Single Deployment License for non-commercial use, and as a Single Domain License or Unlimited Domain License for commercial and/or SaaS use. See our ActiveReportsJS licensing page for full details.
Learn more on our ActiveReportsJS product page.
Highcharts Core (formerly Highcharts JS) is an SVG-based, multi-platform charting library that has been actively developed since 2009. It makes it easy to add interactive, mobile-optimized charts to your web pages and mobile projects. It features robust documentation, advanced responsiveness, and industry-leading accessibility support.
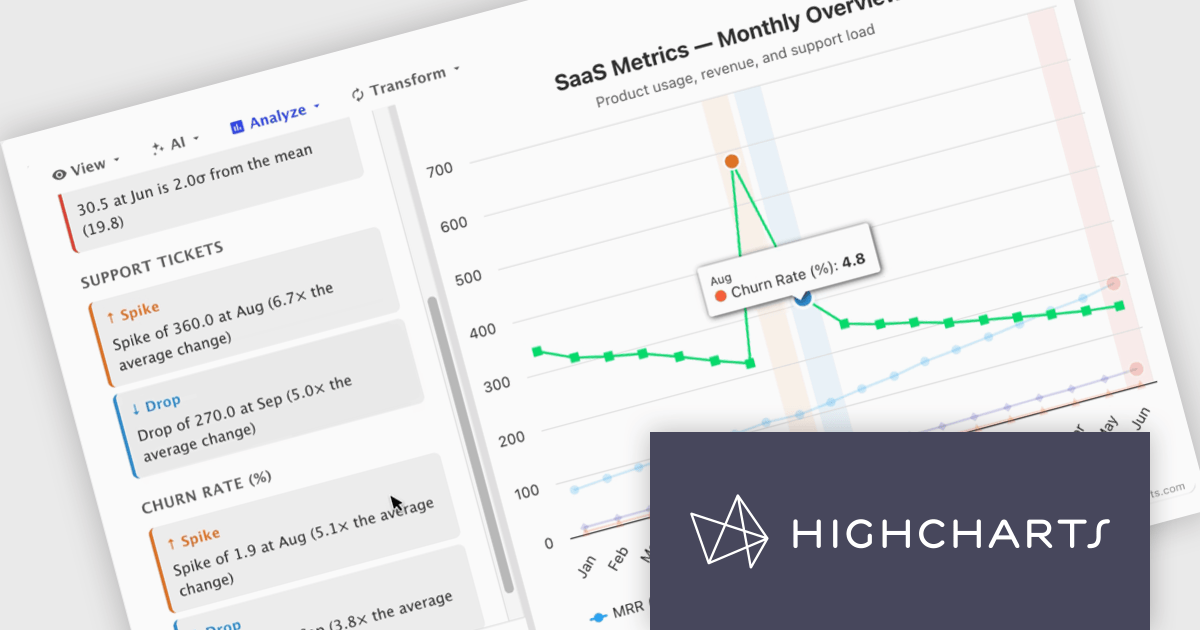
In this blog post, Highcharts' Nancy Dillon introduces you to Highcharts Orbit - A full analytics layer for any Highchart that helps you understand your data via a suite of analysis tools for forecasting, anomaly detection, and reporting. Add it to any Highcharts setup and a toolbar appears above the chart, giving you access to these powerful tools using four menus:
Read the complete blog post and download the fully-featured Preview version now!
Highcharts Core is licensed on an annual or perpetual basis, OEM licenses, and Advantage Renewals. It is licensed per Developer and has several license options including Internal, SaaS, SaaS+, and Self Hosted. See our Highcharts Core licensing page for full details.
Learn more on our Highcharts Core product page.
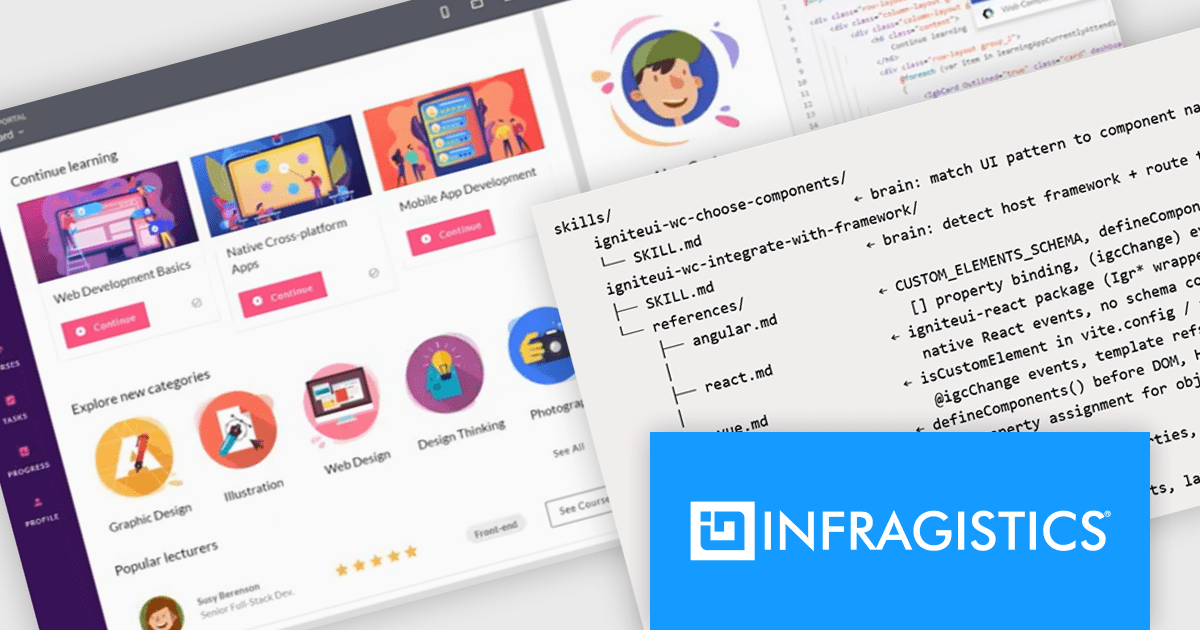
Infragistics Ignite UI for Web Components is a library of standards-based UI components designed to help developers build modern, high-performance web applications using native browser technologies. It provides a rich collection of data-intensive controls, including data grids, charts, and editors, all built as reusable custom elements. The library focuses on delivering responsive user experiences, strong accessibility support, and advanced data visualization capabilities, enabling development teams to create enterprise-grade applications while maintaining flexibility in their technology choices.
The latest Ignite UI for Web Components release introduces four AI skill files that are included directly in the npm package. These structured guidance files provide GitHub Copilot, Claude, Cursor, and other large language model (LLM) coding agents with library-specific instructions for common development tasks. By giving AI assistants a deeper understanding of recommended patterns, component usage, and implementation approaches, the skills help developers generate more accurate code suggestions and achieve better results when building applications with Ignite UI for Web Components.
Infragistics Ignite UI for Web Components is part of Infragistics Ignite UI which is licensed per developer and is available as a Perpetual License with a 1, 2 or 3 year support and maintenance subscription. See our Infragistics Ignite UI licensing page for full details.
Infragistics Ignite UI for Web Components is available in the following products:
联系电话: (888) 850 9911
传真: +1 770 250 6199


