


官方供应商
我们作为官方授权经销商,直接提供超过200家开发厂家所发行超过1000个的产品授权给您。
查看我们的所有品牌。
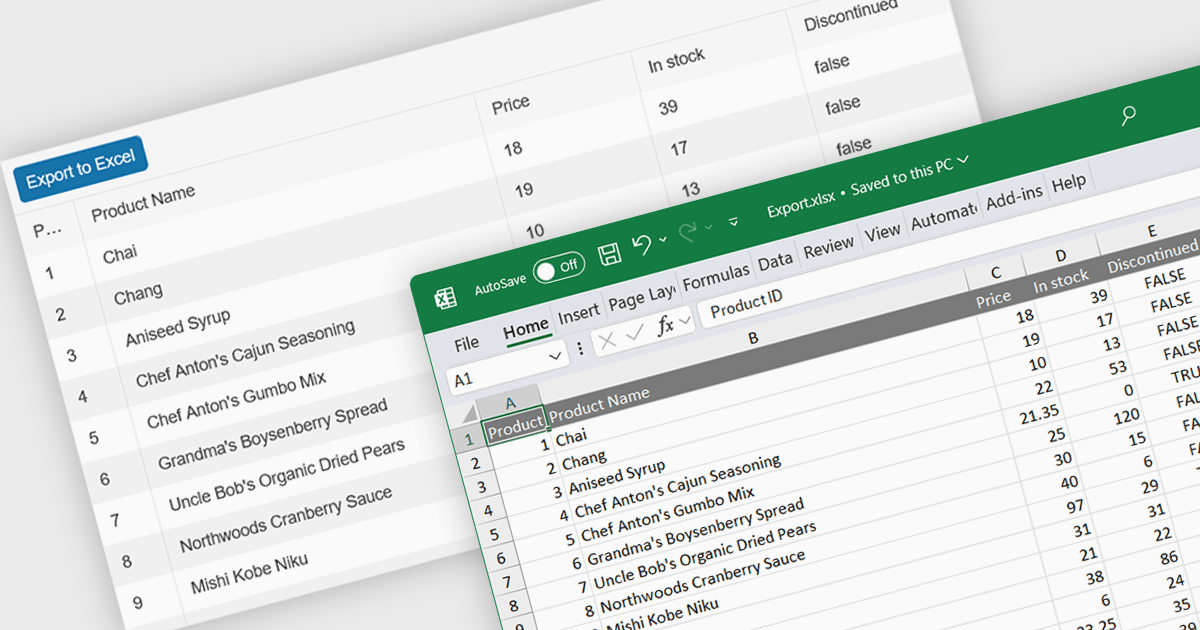
Spreadsheet component with XLSX export functionality allow users to output spreadsheet data into the industry standard Excel-compatible format. This feature is especially useful for applications where data needs to be analyzed, shared, or integrated into external workflows. By enabling XLSX export, users can download structured data directly from the web application in a format widely supported across platforms and software. The benefits of this functionality include maintaining data accuracy, preserving formatting, and supporting large datasets with advanced features like formulas, filters, and charts. Use cases for XLSX export range from financial dashboards and inventory management systems to data analytics platforms and collaborative tools, offering users the flexibility to work offline or share data in a familiar format.
Several React spreadsheet components offer XLSX export, including:
For an in-depth analysis of features and price, visit our React spreadsheet controls comparison.
Kendo UI by Telerik is a comprehensive suite of JavaScript UI components designed to accelerate web application development. Offering pre-built, customizable elements for grids, charts, schedulers, and more, it streamlines UI creation across popular frameworks like jQuery, Angular, React, and Vue. Key features include responsive design, accessibility, and high performance, enhancing user experience. Developers benefit from reduced development time, consistent UI patterns, and the ability to build feature-rich applications faster.
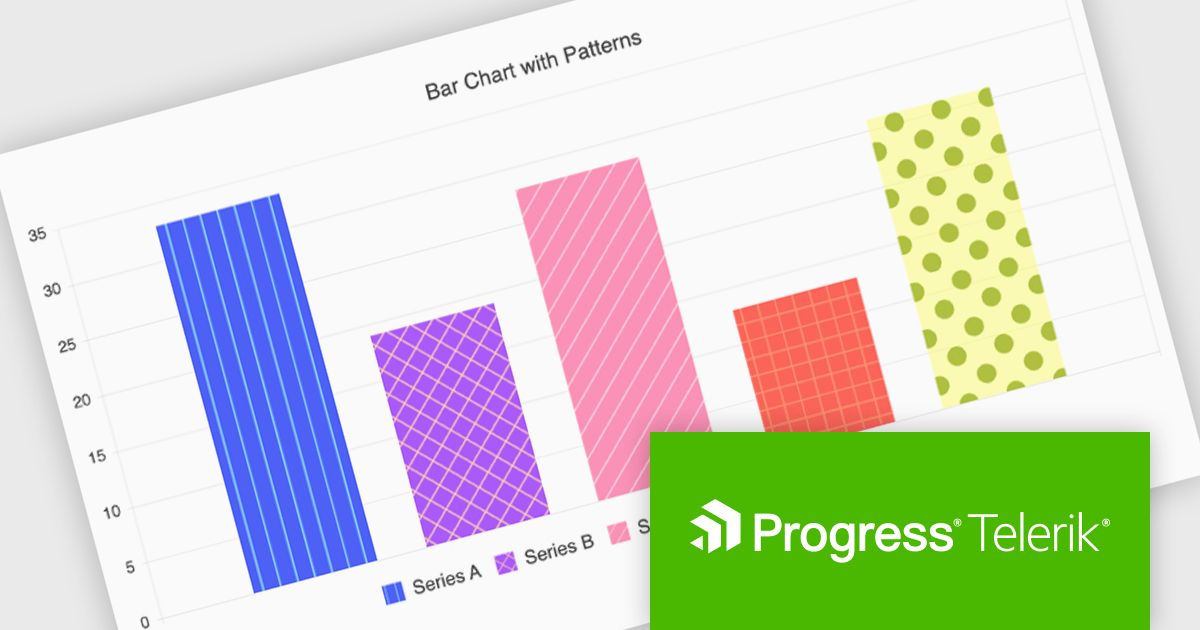
The Kendo UI for Angular v17.1.0 release (part of the 2024 Q4 update) introduces flexible pattern designs for chart series, allowing developers to create visually distinctive and accessible data visualizations. By providing an alternative to solid colors, patterns such as stripes, dots, or grids improve clarity in charts, especially for users with color vision deficiencies or when detailed data differentiation is needed. This feature enables developers to align visualizations with branding guidelines or specific design needs while enhancing the overall user experience with more intuitive and inclusive data representations.
To see a full list of what’s new in v17.1.0 (2024 Q4) see our release notes.
Kendo UI is licensed per developer and is available as a perpetual license with a 1 year support subscription, which is available in 3 tiers: Lite, Priority or Ultimate. See our Kendo UI licensing page for full details.
Kendo UI is also available to buy individually or as part of:
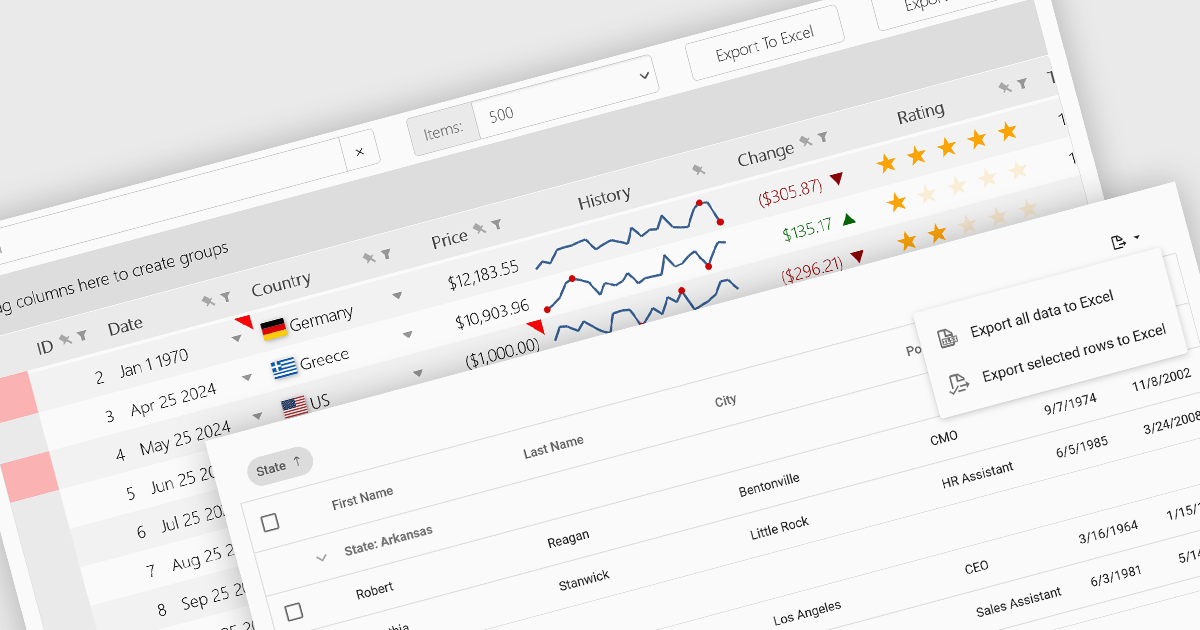
Grid controls with support for exporting to Excel offer users a portable and widely compatible format ideal for offline access, advanced analysis, and custom reporting. Excel’s powerful capabilities, including pivot tables, formulas, and charting tools, allow users to perform sophisticated tasks that go beyond the grid’s native functionality. Additionally, this feature facilitates seamless integration with other workflows and systems, supporting record-keeping, collaboration, and compliance requirements. By enabling greater flexibility and productivity, Excel export functionality significantly enhances the value and usability of grid applications.
Several React grid controls offer the ability to export grids to Excel including:
For an in-depth analysis of features and price, visit our React grid controls comparison.
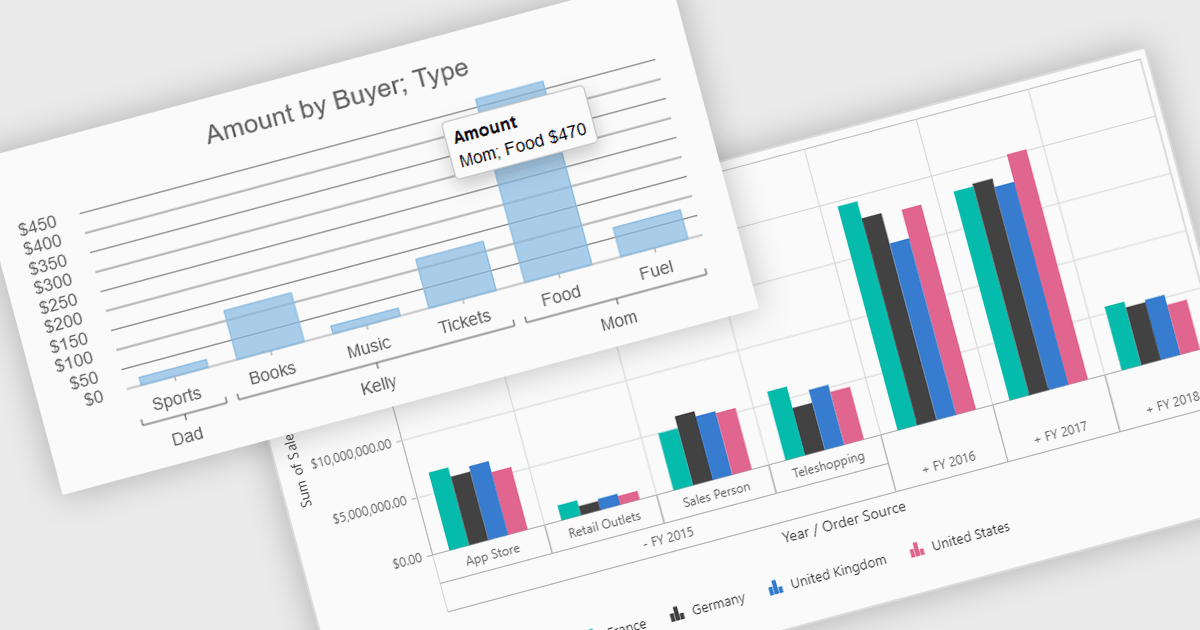
Pivot charts are dynamic visualization tools that enable users to interact with and analyze data in a highly flexible manner. They extend the capabilities of pivot tables by providing visual representations of aggregated data, making it easier to identify trends, patterns, and outliers. Key benefits include real-time updates, intuitive interactivity, and support for multi-dimensional data analysis, which simplifies complex datasets into actionable insights. Integrating pivot charts into your applications empowers end-users to explore and present data in a way that is both visually compelling and deeply informative.
Several React UI suites offer pivot chart components including:
For an in-depth analysis of features and price, visit our comparison of React UI Suites.
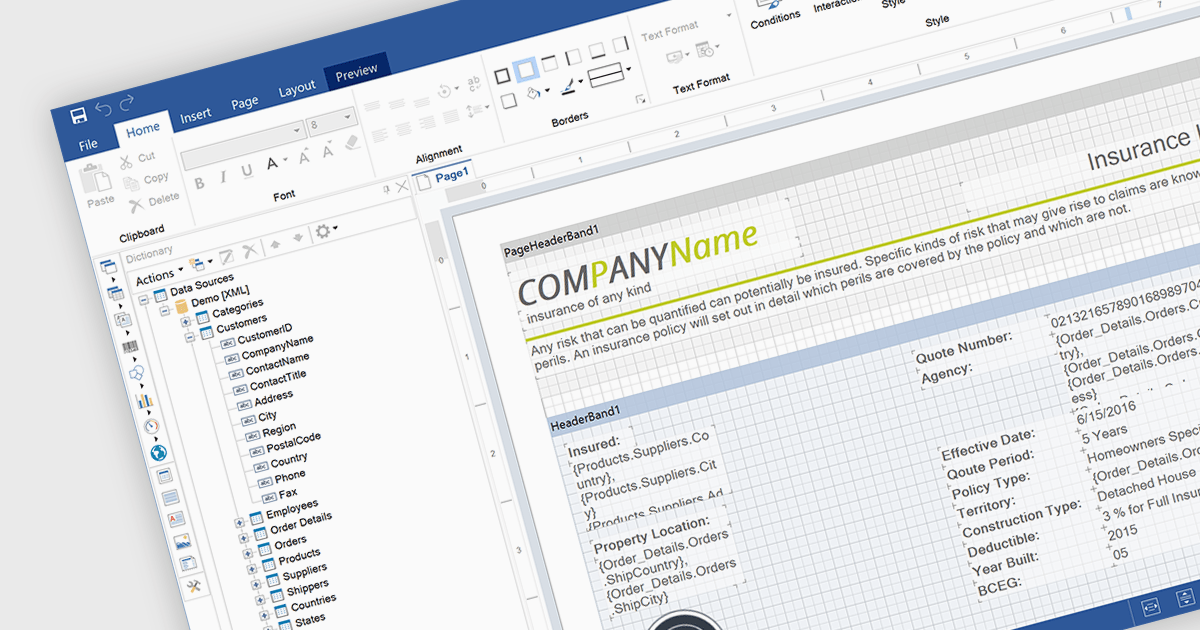
An end user report designer is a browser-based tool that allows non-technical users to create, edit, and customize reports directly within a web application, without needing to write code. It provides an intuitive interface for manipulating data fields, applying filters, formatting content, and configuring layouts, enabling efficient report creation that meets specific business needs. For developers, integrating such a designer reduces the overhead of building and maintaining custom reporting solutions, enhances user autonomy, and improves overall user satisfaction by empowering clients to adapt reports dynamically as their requirements evolve.
Several JavaScript Reporting controls offer an end user report designer including:
For an in-depth analysis of features and price, visit our comparison of JavaScript Reporting Controls.
联系电话: (888) 850 9911
传真: +1 770 250 6199


