


官方供应商
我们作为官方授权经销商,直接提供超过200家开发厂家所发行超过1000个的产品授权给您。
查看我们的所有品牌。
Wijmo is a complete collection of extensible, fast, flexible JavaScript UI components written in TypeScript. The framework-agnostic Wijmo components include first-class support for top frameworks including Angular, React, Vue and Web Components. Wijmo Enterprise has over 100 dynamic UI components to help cut your development time in half, allowing you to build lightweight, high-performance JavaScript applications using your favorite JavaScript framework.
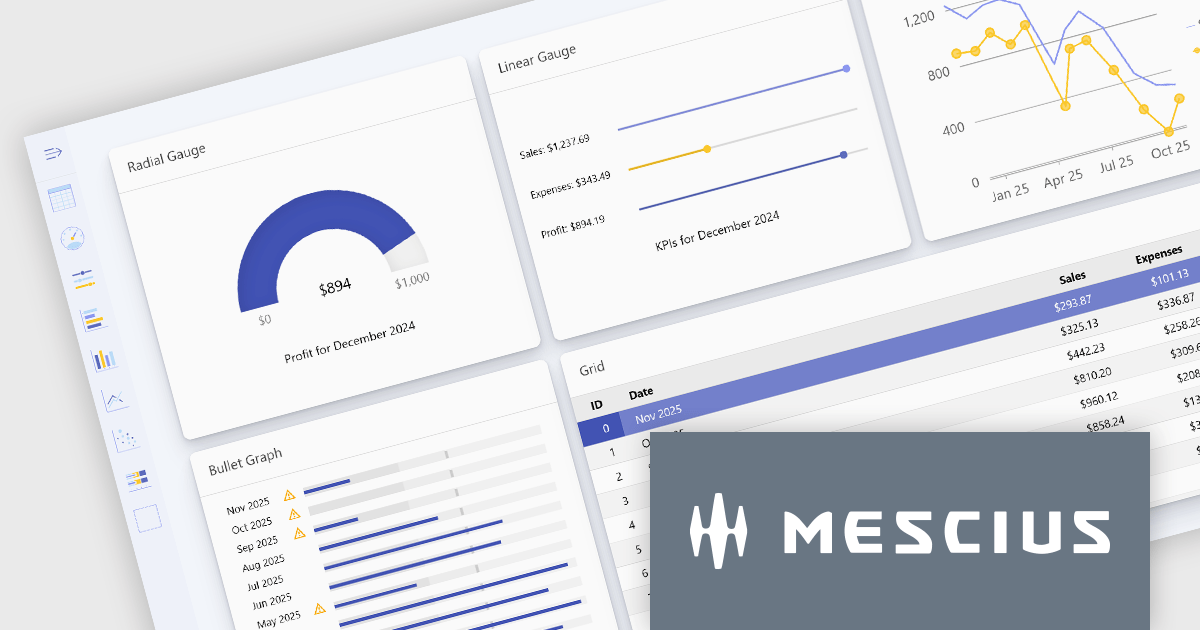
Wijmo's dynamic dashboard sample allows users to create customizable, interactive dashboards, similar to those seen in Google Analytics. The new version of the dashboard, now built with React, offers a range of key features including touch-screen support, drag-and-drop functionality, and pre-defined tile types, making it an ideal solution for users looking to create personalized, data-rich visualizations.
In this blog post, MESCIUS Product Marketing Specialist Grant Katanick takes you through the steps for creating a dynamic dashboard for your JavaScript web applications. Key features of the React-based dashboard include:
Detailed sample source code is included that you can use as a starting point for your actual dashboard applications.
Read the complete blog to get started building dynamic dashboards with React and Wijmo.
Wijmo is licensed per developer. Developer licenses are perpetual and include 1 year subscription which provides upgrades, including bug fixes and new features. See our Wijmo licensing page for full details.
For more information, visit our Wijmo product page.

Cell merging in a grid allows developers to combine adjacent cells, creating a single, unified cell that spans multiple rows or columns. This feature enhances readability by allowing headers or labels to encompass related data fields, reducing redundancy and making complex data layouts more visually coherent. It enables efficient organization, supporting custom layouts that align with specific reporting needs and enhancing the grid's overall aesthetic. Cell merging helps streamline the user experience by condensing information into easily digestible sections, enabling users to focus on key insights without distraction.
Several React grid controls offer cell merge support including:
For an in-depth analysis of features and price, visit our React grid controls comparison.

Bullet charts are efficient data visualization tools designed to display performance metrics against a target within a single, streamlined bar. Ideal for compact spaces on dashboards, bullet charts convey a KPI's current status, target, and performance range in a minimalist view, making them perfect for summarizing key data points without overwhelming the interface. They are highly customizable, supporting varied colors, labels, and thresholds, and their component-based structure in React allows developers to implement real-time updates, enabling users to monitor changing data continuously. These charts promote a responsive, interactive experience, providing powerful options for building detailed, data-rich applications.
Several React chart controls offer bullet chart support including:
For an in-depth analysis of features and price, visit our React bullet chart controls comparison.

Charts in a dashboard component transform raw data into clear, actionable visuals, making it easy to monitor trends, track performance, and spot critical insights in real time. These interactive tools support various use cases, from sales forecasting and KPI tracking to project progress monitoring and customer behavior analysis. By offering a centralized, intuitive view of essential metrics, charts help teams make faster, data-driven decisions, optimize operational efficiency, and respond proactively to emerging opportunities or issues.
Several JavaScript products offer chart components with dashboard support including:
Explore our range of JavaScript dashboard components.
Need help to find the right software license, upgrade or renewal? Call, Email, or Live Chat with our experts.

Printing functionality in reporting controls allows users to generate physical or digital copies of reports directly from within the software, ensuring seamless access to formatted, ready-to-distribute documents. This capability is especially valuable in data-driven applications where users need to share insights in a standardized format, such as in financial, operational, or compliance reporting. With printing support, users can define how reports appear on paper or in PDF format, often choosing custom layouts, page sizes, or specific sections for export, all of which aid in producing polished and accessible presentations of data. By reducing the manual steps needed to prepare data for distribution, printing functionality helps streamline workflows and enhance the utility of reporting tools for both internal and external stakeholders.
Several React reporting controls offer printing support including:
For an in-depth analysis of features and price, visit our React Reporting controls comparison.
联系电话: (888) 850 9911
传真: +1 770 250 6199


